
This week we're going to review OPEC's August Oil Market Report (covering July OPEC & global oil data), which was released on Friday of this past week and is available as a free download, and hence it's the report we check for monthly global oil supply and demand data. As you’ll see, it shows there was a large shortfall in the amount of oil produced in July, a story that doesn’t seem to be being told elsewhere, as even the analysts don’t read the entire report (100+ pages) & the media keeps telling the 2 year old story of an oil glut.
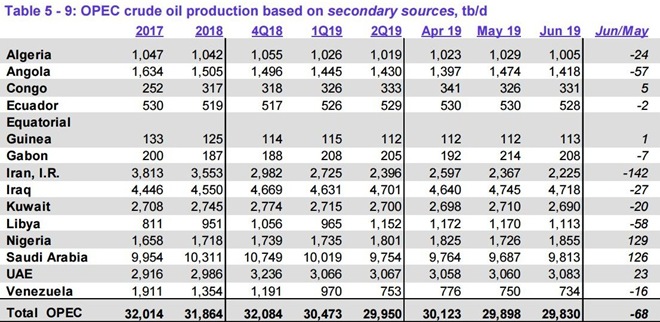
The first table from this monthly report that we'll look at is from the page numbered 60 of that report (pdf page 70), and it shows oil production in thousands of barrels per day for each of the current OPEC members over the recent years, quarters and months, as the column headings indicate. For all their official production measurements, OPEC uses an average of estimates from six "secondary sources", namely the International Energy Agency (IEA), the oil-pricing agencies Platts and Argus, the U.S. Energy Information Administration (EIA), the oil consultancy Cambridge Energy Research Associates (CERA) and the industry newsletter Petroleum Intelligence Weekly, as a means of impartially adjudicating whether their output quotas and production cuts are being met, to thus avert any potential disputes that could arise if each member reported their own figures...

As we can see from the above table of oil production data, OPEC's oil output fell by 246,000 barrels per day to 29,609,000 barrels per day in July, from their revised June production total of 29,855,000 barrels per day. However that June figure was originally reported as 29,830,000 barrels per day, so that means their production for July was actually a 221,000 barrel per day decrease from the previously reported production figures (for your reference, here is the table of the official June OPEC output figures as reported a month ago, before this month's revisions)...
As you can see, the Saudi's 134,000 barrel per day output cut made up the lion's share of OPEC's July decrease. but most other OPEC members also cut their output proportionately as well. However, that relatively small 32,000 barrels per day increase in the output from Iraq that you see above means they are well over thei output allocation as originally determined for each OPEC member after their December 7th, 2018 meeting, when OPEC agreed to cut 800,000 barrels per day as part of a 1.2 million barrel per day cut agreed to with Russia and other oil producers, and which were extended at their July 1st meeting a a little over a month ago.. In addition, despite the small decrease in July output from Nigeria, their output also remains well above quota, as can be seen in the table of OPEC production allocations we've included below:

The above table came from a February 6th post on Saudi cuts and OPEC allocations at S&P Global Platts, and it shows average daily production quota in millions of barrels of oil per day for each of the OPEC members as was agreed to at their December 2018 meeting and has now been extended through March 2020 as of their recent meeting....note that Venezuela and Iran, whose oil exports are being sanctioned by the Trump administration, and Libya, which has been beset by a civil war, are exempt from any production quotas, and that among them only Libya has been producing a bit more than they did in the 4th quarter of 2018, which you can see in the third column of the OPEC production table above...
The next graphic from the report that we'll include shows us both OPEC and world oil production monthly on the same graph, over the period from August 2017 to July 2019, and it comes from page 61 (pdf page 71) of the August OPEC Monthly Oil Market Report....on this graph, the cerulean blue bars represent OPEC oil production in millions of barrels per day as shown on the left scale, while the purple graph represents global oil production in millions of barrels per day, with the metrics for global output shown on the right scale...

Despite the big decrease in OPEC's production from what they produced a month ago, their preliminary estimate indicates that total global oil production still rose by 0.23 million barrels per day to 98.71 million barrels per day in July, an increase that came after June's total global output figure was revised down by 80,000 barrels per day from the 98.56 million barrels per day global oil output that was reported a month ago, as non-OPEC oil production rose by a rounded 480,000 barrels per day in July after that revision, with higher oil production from Canada, Norway, the UK, Australia, India, Brazil and Azerbaijan the major reasons for the non-OPEC output increase in July. The 98.71 million barrels per day produced globally in July was also 0.71 million barrels per day, or 0.7% higher than the revised 98.39 million barrels of oil per day that were being produced globally in July a year ago (see the August 2018 OPEC report (online pdf) for the originally reported July 2018 details). With the decrease in OPEC's output, their July oil production of 29,609,000 barrels per day slipped to 30.0% of what was produced globally during the month, down from the revised 30.3% share they contributed in June. OPEC's July 2018 production was reported at 32,323,000 barrels per day, which means that the 13 OPEC members who were part of OPEC last year, excluding Qatar from last year's total and new member Congo from this year's, are now producing 2,424,000 fewer barrels per day of oil than they were producing a year ago, when they accounted for 32.9% of global output, with a 1,524,000 barrel per day drop in output from Iran, a 689,000 barrel per day decrease in the output from Saudi Arabia, and a 534,000 barrel per day decrease in the output from Venezuela from that time more than offsetting the year over year production increases of 414,000 barrels per day from Libya, 197,000 barrels per day from Iraq, and 112,000 barrels per day from the Emirates...
Despite the 230,000 barrels per day increase in global oil output that was seen during July, there was still a large shortfall in the amount of oil being produced globally during the month, as this next table from the OPEC report will show us...

The table above came from page 33 of the August OPEC Monthly Oil Market Report (pdf page 43), and it shows regional and total oil demand in millions of barrels per day for 2018 in the first column, and OPEC's estimate of oil demand by region and globally quarterly over 2019 over the rest of the table. On the "Total world" line in the fourth column, we've circled in blue the figure that's relevant for July, which is their revised estimate of global oil demand during the third quarter of 2019...
OPEC has estimated that during the 3rd quarter of this year, all oil consuming regions of the globe will using 100.69 million barrels of oil per day, which was revised from their estimate of 100.61 million barrels of oil per day for the 3rd quarter a month ago. Meanwhile, as OPEC showed us in the oil supply section of this report and the summary supply graph above, OPEC and the rest of the world's oil producers were still only producing 98.71 million barrels per day during July, which means that there was a shortfall of around 1,980,000 barrels per day in global oil production when compared to the demand estimated for the month...
In addition, the downward revision of 80,000 barrels per day to June's global output that's implied in this report, combined with the 10,000 barrels per day upward revision to 2nd quarter demand that we've encircled in green, means that the 680,000 barrels per day shortfall that we had previously figured for June based on last month's figures would now be revised to a deficit of 790,000 barrels per day. Likewise, the 10,000 barrels per day upward revision to 2nd quarter demand would mean that we'd have to revise our global oil deficit for May to 1,160,000 barrels per day, and revise our global oil deficit for April to 1,030,000 barrels per day...hence, for the 2nd quarter as a whole, the world's oil producers were producing 937,000 barrels per day less than what was needed...
Note that in green we've also circled an upward revision of 30,000 barrels per day to first quarter demand. That means that the global oil surplus of 190,000 barrels per day we had previously figured for March would have to be revised to a global oil surplus of 160,000 barrels per day. Similarly, the 640,000 barrel per day global oil output surplus we had for February would now be a 610,000 barrel per day global oil output surplus, and the 550,000 barrel per day global oil output surplus we had for January would be revised to a 520,000 barrel per day oil output surplus..
Our green ellipse above also highlights that OPEC has revised 2018's oil demand 80,000 barrels per day higher. When demand for 2018 was last revised in April, we recomputed our 2018 figures and figured that for all of 2018, global oil demand exceeded production by roughly 18,040,000 barrels. This revision means that the 2018 shortfall was 80,000 barrels per day higher, or a total shortfall of roughly 47,240,000 barrels of oil for the year as a whole..
note: the above was excerpted from my weekly synopsis at Focus on Fracking…
Comments
Thanks for your good text this week
There can be some who make 100K+ with no worry, but the more you make the more pressure you choose on.