
The Manufacturing and Trade Sales and Inventories report shows a -1.1% decrease in sales and an +0.1% increase in inventories for June 2012. Sales declined -1.1% for manufacturers, -0.8% for retailers and -1.4% for wholesalers. This is the 3rd month in a row for declining sales and this is the largest monthly percentage decrease since March 2009.
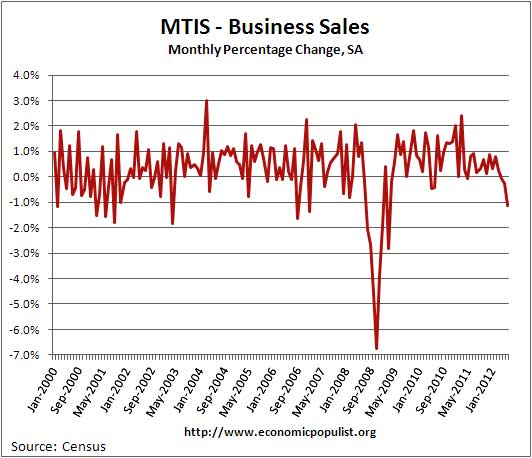
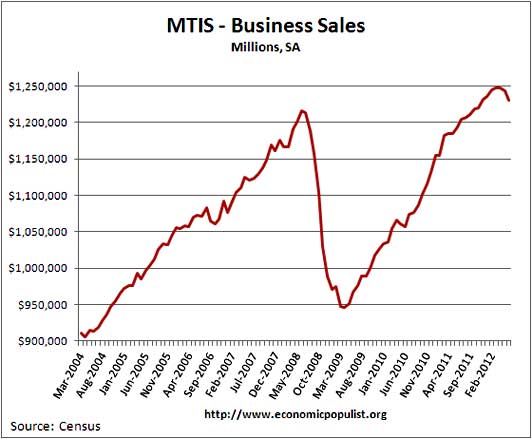
This is not a good sign for the economy. The change between Q2 and Q1 annualized sales is -0.78%, again not seen since Q2 2009. Business sales declined -0.26% for May and -0.07% for April. Below are manufacturing and trade sales by volume and again we see a similar slope emerging that is all too reminiscent of 2009.
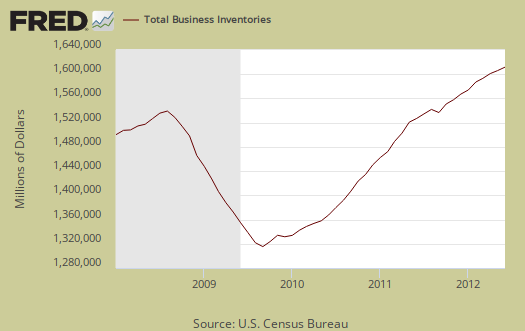
Below are total business inventories, which stand at $1.58 trillion. Business inventories have increased 5.0% from a year ago, whereas sales have only increased 3.0% from June 2011.
Inventories for merchant wholesalers decreased -0.2%, manufacturers' inventories increased +0.1% and retailer's inventories increased +0.6%. Below is the monthly percent change for business inventories.

A really bad sign of this report is the inventory to sales ratio, now at 1.29. If inventories accumulate, and sales are declining, that's not good news for economic growth and even worse news potentially down the road as businesses try to shed their excess inventories by any means possible. Notice this ratio increases before and during recessions. In other words, with this June 2012 MTIS report, business statistics look like the beginning of the great Recession.
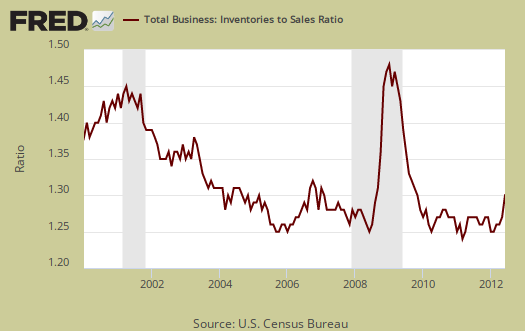
The last time overall business sales to total inventories ratio was this high was in February 2010, but that's on a downward slope trajectory. In February 2010 sales and inventories were recovering from the Great Recession. In February 2008, we saw the sales to inventory ratio increase to 1.29.
The June 2012 breakdown of inventories to sales is even worse, manufacturers are 1.29, retailers are 1.38 and wholesalers are 1.20.
This report includes:
The data that is used as input for the Manufacturing and Trade Inventories and Sales (MTIS) economic indicator release is collected by three separate surveys: the Manufacturers' Shipments, Inventories and Orders Survey (M3), the Monthly Wholesale Trade Survey (MWTS), and the Monthly Retail Trade Survey (MRTS).
This Census economic report covers Retail, Manufacturing and Wholesale inventories, which is pretty much most of the non-farm inventories the BEA uses for their change in private inventory calculations in the GDP report and national accounts. There are a host of adjustments, including inventory valuation that the BEA does to changes in private inventories for national accounts. NIPA is the big, gigantic "ledger" of the national books and from where GDP is calculated.
The change in non-farm private inventories contributed -0.39 percentage points of the 1.5% Q2 GDP, annualized, quarterly in real 2005 dollars.
Here is last month's overview only graphs revised.
The MTIS was actually released on August 14th. We had technical difficulties that day but considering the warning signs contained within this statical release, we had to show you what we saw. Let's hope it's an anomaly and not the start of something bad.
Recent comments