
The S&P Case Shiller home price index shows a -4.5% decline from a year ago over 20 metropolitan housing markets and a -3.8% decline for the top 10 housing markets from June 2010.
Below is the yearly percent change in the composite-10 and composite-20 Case-Shiller Indices. These are not seasonally adjusted, but comparing from June 2010. As you can see, there is clearly a new decline going on for 2011, although this month, the rate of that decline has slowed.

Wondering why we have conflicting news headlines on the S&P Case-Shiller Housing Index? Because some in the press use the seasonally adjusted data and others do not. To make matters worse, some compare the not seasonally adjusted monthly results and others the housing price index in comparison to one year ago. For example, the not seasonally adjusted change for the composite-20 was 1.1% from May to June. The Seasonally adjusted composite-20 percentage change was -0.1%. Same situation for the composite-10 index. The not seasonally adjusted composite-10 increased 1.1% from May to June, but seasonally adjusted? That flat-lined, no change and was also zero from April to May.

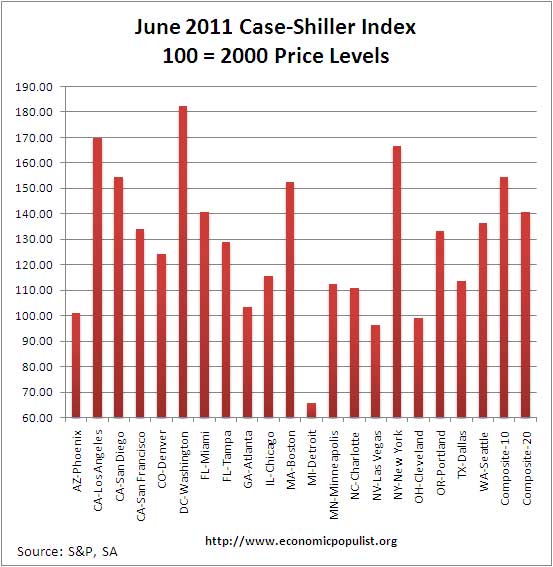
The above graph shows the composite-10 and composite-20 city home prices indexes, seasonally adjusted. Prices are normalized to the year 2000. The index value of 150 means single family housing prices have appreciated, or increased 50% since 2000 in that particular region. These indices are not adjusted for inflation. The composite-20 index, seasonally adjusted is 140.76 and comparable to May 2003 levels (ignoring 2009). Not seasonally adjusted the composite-20 index is 141.30, which also is slightly above May 2003 levels.
The S&P/Case-Shiller Home Price Indices are calculated monthly using a three-month moving average and published with a two month lag. Their seasonal adjustment calculation is the standard used for all seasonal adjustments, the X-12 ARIMA, maintained by the Census.
So, why would S&P report the not seasonally adjusted data, when we all know spring is the start of house buying and building season? According to their paper on seasonal adjustments, they claim the not seasonally adjusted indices are more accurate. Why? It appears the housing bubble and bust has screwed up the cyclical seasonal pattern. What a surprise.
The turmoil in the housing market in the last few years has generated unusual movements that are easily mistaken for shifts in the normal seasonal patterns, resulting in larger seasonal adjustments and misleading results.
Not seasonally adjusted data creates more headline buzz. S&P does make it clear that data should be compared to a year ago, to remove seasonal patterns, yet claims monthly percentage changes should use not seasonally adjusted indices and data. This seems invalid for housing markets are highly seasonal. Below are the seasonally adjusted indices for June 2011.
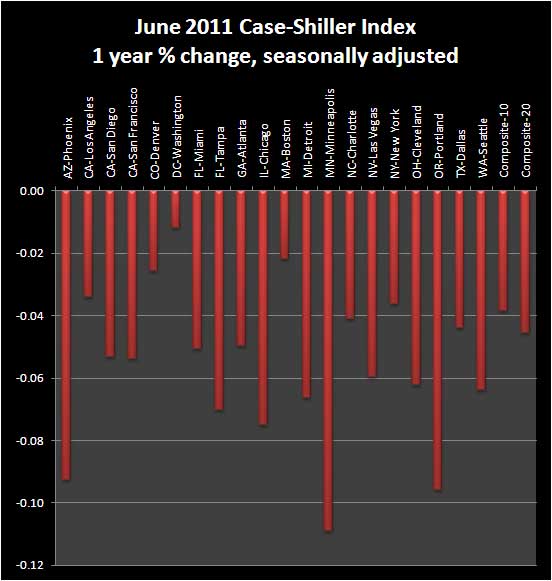
For June 2011, the S&P/Case-Shiller Home Price indexes shows all 20 cities tracked are down for the year.
Below are all of the composite-20 index cities yearly price percentage change, using the seasonally adjusted data.
Calculated Risk, has additional custom graphs and data analysis and is the uber site for residential housing, with valid statistical analysis.
It's clear foreclosures and distressed sales are simply blowing up seasonal and not seasonal monthly adjustment data. At the end of Q2 2011, while foreclosure starts were down to Q4 2007 levels, actual delinquencies increased:
In the second quarter, the delinquency rate for mortgages on one- to four-unit residential properties reached a seasonally adjusted 8.44%, up from 8.32% in the first quarter, yet still down from 9.85% in the second quarter of 2010, according to the MBA’s quarterly delinquency survey, which covers 43.9 million mortgages on one-to-four unit residential properties, or about 88% of all first-lien residential mortgages outstanding.
S&P also released Q2 2011 results for housing data. Not seasonally adjusted and from their press release:
Data through June 2011, released today by S&P Indices for its S&P/Case-Shiller Home Price Indices, the leading measure of U.S. home prices, show that the U.S. National Home Price Index increased by 3.6% in the second quarter of 2011, after having fallen 4.1% in the first quarter of 2011. With the second quarter’s data, the National Index recovered from its first quarter low, but still posted an annual decline of 5.9% versus the second quarter of 2010.
S&P does a great job of making the Case-Shiller data and details available for further information and analysis on their website.
Recent comments