
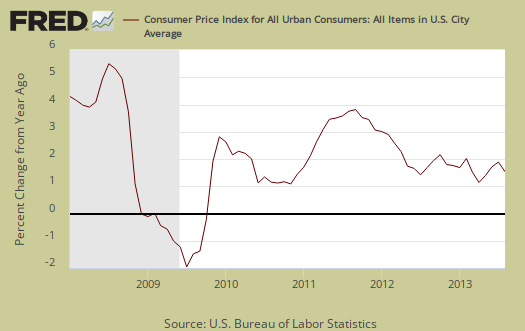
The August Consumer Price Index increased 0.1% from July. CPI measures inflation, or price increases. Take away food and energy out of the picture and inflation still only increased 0.1%, mainly on housing cost increases and medical care. A 0.1% monthly increase is a low rate of inflation.

CPI is now up 1.5% from a year ago as shown in the below graph. This is also a low annual rate of inflation.
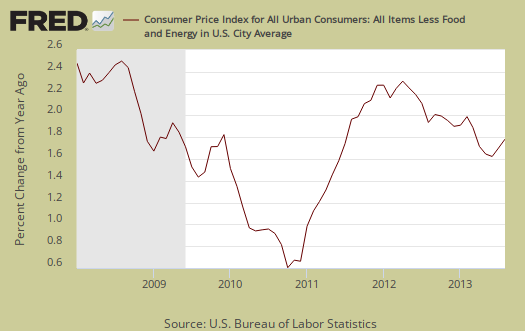
Core inflation, or CPI minus food and energy items, increased 0.1%. Core inflation has risen 1.8% for the last year and since June 2011 has ranged from 1.6% to 2.3%. Core CPI is one of the Federal Reserve inflation watch numbers and 2.0% per year is their boundary figure. Graphed below is the core inflation change from a year ago.
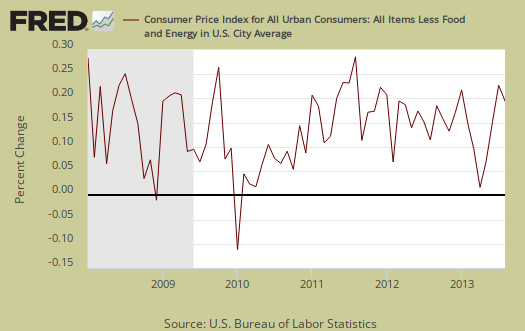
Core CPI's monthly percentage change is graphed below.
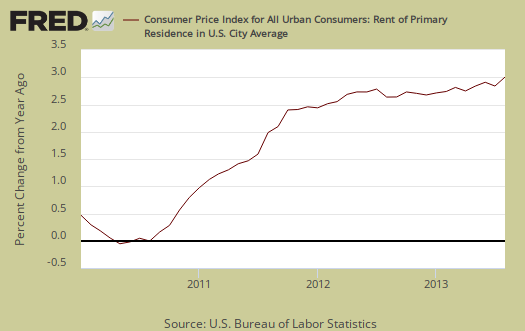
Core inflation's components include shelter, transportation, medical care and anything not food or energy. The shelter index is comprised of rent, the equivalent cost of owning a home, hotels and motels. Shelter increased 0.2% and is up 2.4% for the year. Owning a home increased 0.2% and is up 2.2% for the year. Rent increased 0.4% for the month and has increased 3.0% from a year ago Graphed below is rent, where cost increases hits people who can least afford it most.
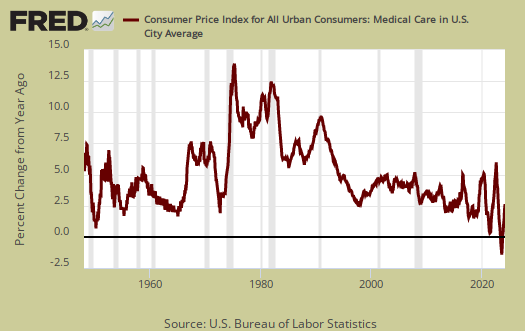
A core inflation cost which almost never drops is medical care. Medical care increased 0.6% with hospital services jumping 1.9% in a month, Without medical, CPI would have been zero for August The Medical care index has increased 2.3% over the last 12 months. Graphed below is the overall medical care index change from a year ago.
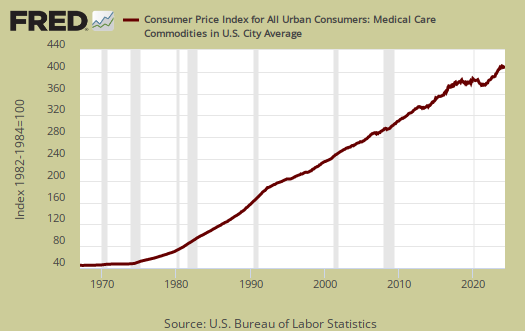
Below is a graph of the medical commodities index, which in large part consists of prescription drug prices and overall increased 0.4% for this month. Notice the beyond belief never ending increases since 1975, yet starting around 2013, we see some drops. Unfortunately the trend did not continue.
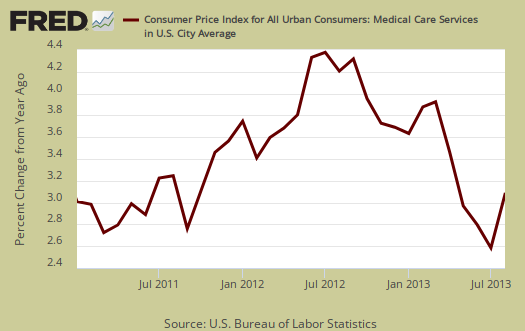
Medical services prices increased 0.7% for August and have increased 3.1% for the year. You'll never see the below graph of Medical care services change from a year ago go below zero, unlike other item prices.
Food and beverages overall increased 0.1% and have increased 1.4% from a year ago. The food at home index (think groceries) also increased 0.1% for the month. Food for home is now up 1.0% for the year. Eating out, or food away from home increased 0.2% from last month and is up 2.0% from a year ago. Graphed below is the overall food index.

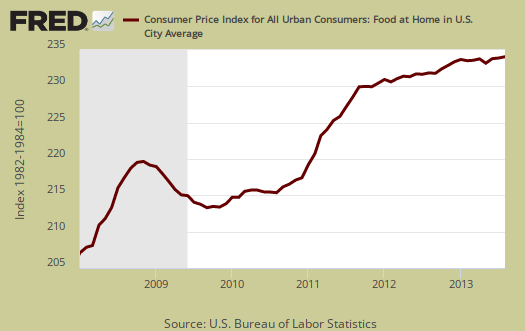
Graphed below is the food at home index. CPI does numerous substitutions on food, where if the price of steak increases, they claim hamburger is equivalent. Substitutions in part explain why you see $7 for some crappy frozen take out at the grocery, yet the food index rise appears relatively tame. From the BLS:
The index for fruits and vegetables continued to rise, increasing 1.2 percent after a 1.5 percent advance inJuly. The index for meats, poultry, fish, and eggs rose for the third month in a row, increasing 0.6 percent. The index for dairy and related products turned up in August, increasing 0.4 percent after declining in each of the three previous months, and the index for cereals and bakery products rose 0.3 percent in August after declining0.3 percent in July.
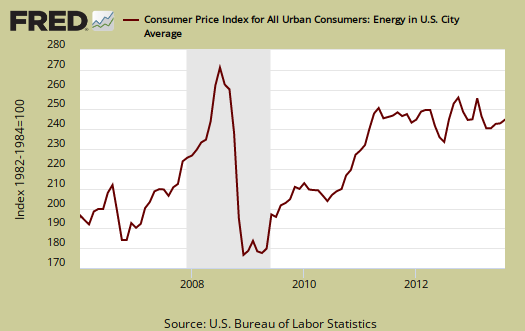
Energy overall declined -0.3% and energy costs are now down -0.1% for the entire year. The BLS separates out all energy costs and puts them together into one index and this one includes gasoline which declined -0.1% for the month and has declined -2.4% for the year. We'd like to see the pump the BLS is going to, for we sure cannot prove that decline in the West. Natural gas is now up 4.8% from a year ago after a monthly decline of -2.3%. Energy costs are also mixed in with other indexes, such as heating oil for the housing index and gas for the transportation index. Below is the overall CPI energy index, or all things energy.
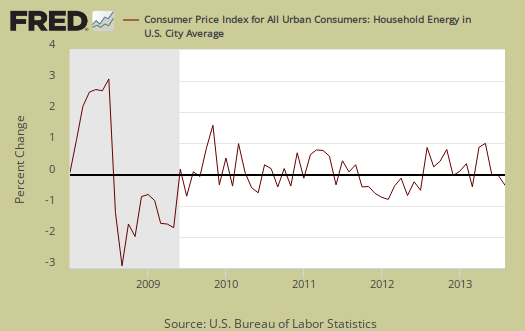
Graphed below is the household energy index which includes electricity and natural gas, shown by monthly percentage change. Household energy dropped -0.5% and for the year has increased 3.1%. This is a different, special index to show the overall costs for energy into your home only. Household energy represents about 4.1% of month assumed expenditures, yet for the poor or those on fixed incomes, we suggest this is a critical inflation measure, to heat or cool one's home.
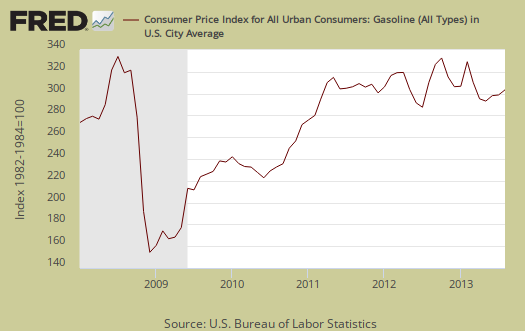
Graphed below is the CPI gasoline index only, which shows the volatility of gas prices. This isn't the first time, nor will it be the last, where the monthly inflation numbers jump on gas prices.
According to the BLS, for the year, food and beverages, which includes food at home, made up 15.3% of the index. Housing is 41% and transportation, including gas for the car, is 16.9% and all energy is 9.5%. Medical care is only 7.2%, they claim, which goes to show what averages can remove. Most people are not sick and why the average costs are so low. A Medical event can bankrupt a family, with insurance.
CPI-W is used to calculate government transfer payments, such as social security increases. CPI-W increased 0.1% and for the year has increased 1.5%. This index is not seasonally adjusted.
Another interesting thing was the BLS is now refusing to published chained CPI. the index proposed to reduce your social security benefits, endorsed by Obama. This is most bizarre and perhaps an agenda to hide the fact this index will reduce earned benefits. Don't worry for the monthly indexes will be published and we'll be sure to number crunch out those averages for you.
The final revisions of the C-CPI-U indexes for 2012 will be available in February 2014. Annual average indexes for C-CPI-U series will not be published for time periods after 2012. (Monthly C-CPI-U indexes will continue to be published.) In February 2014, the annual average indexes for the final estimates for 2012 C-CPI-U series will be published in the public CPI database. Table 1CA will not be published.
CPI details
The DOL/BLS does take yearly surveys on where the money goes in the monthly budget, but as one can see, food and energy are significant amounts of the monthly finances. Run away costs in these two areas can break the bank, so can food. Additionally CPI uses substitution, so if flour goes through the roof, somehow we're all just fine with oats and prices didn't really overall increase much. Here is the BLS CPI site, where one can find much more details, information on calculation methods and error margins.
Other CPI report overviews, unrevised, although most graphs are updated, are here. If you're wondering why the graphs look weird, the graph calculates percentages from the index and doesn't round. The actual data from the BLS report does round to one decimal place. In other words, 0.05% is rounded to 0.1%.
Recent comments