
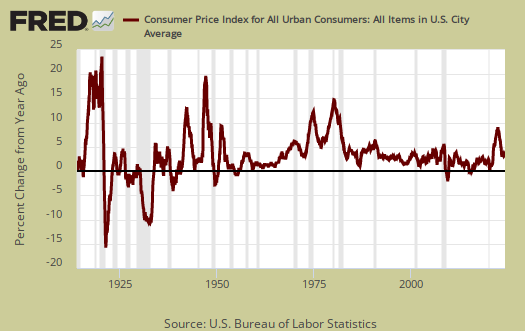
The Consumer Price Index ballooned up by 0.4% for April as energy prices jumped up 3.4%. Gasoline alone really shot up, 8.1% for the month. Inflation with food and energy price changes removed increased 0.2% with shelter and medical costs once again increasing. From a year ago overall CPI has increased 1.1%. Without energy and food considered, prices have increased 2.1% for the year. CPI measures inflation, or price increases.
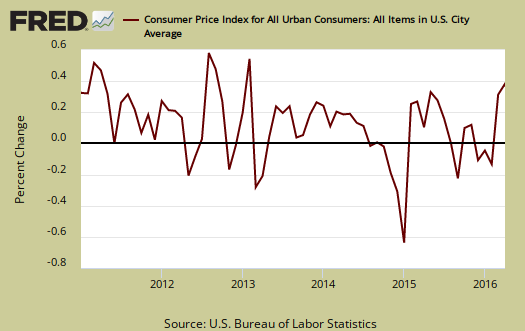
Yearly overall inflation is shown in the below graph.
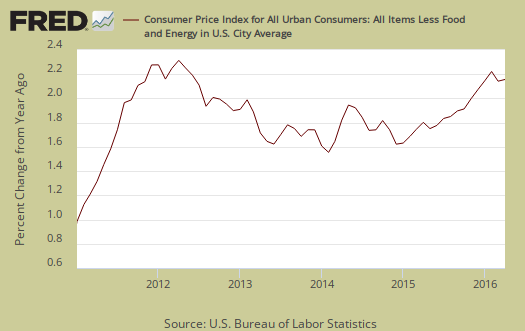
Core inflation, or CPI with all food and energy items removed from the index, has increased 2.1% for the last year. For the past decade the annualized inflation rate has been 1.9%.
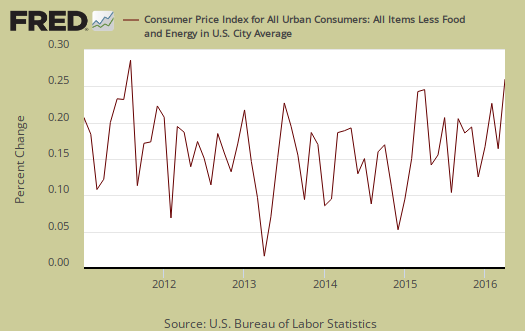
Core CPI's monthly percentage change is graphed below. This month core inflation increased 0.2%. Within core inflation, shelter increased 0.3%, with monthly rental costs increasing the same as home ownership, 0.3%. Hotels and lodging away from home increased 0.4%. Water, sewer and trash services increased 0.5% for the month in price. Transportation really flew up with a 0.7% increase and within leasing vehicles also increased 0.7%.
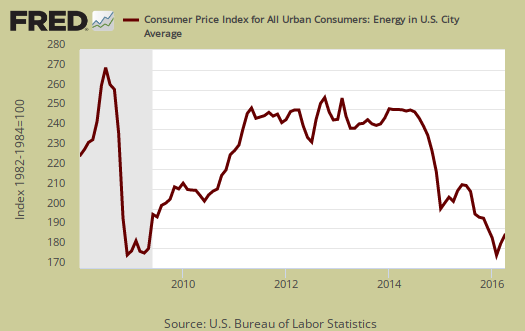
The energy index is down -8.9% from a year ago. The BLS separates out all energy costs and puts them together into one index. For the year, gasoline has declined --13.8%, while Fuel oil has dropped -27.5%. Graphed below is the overall CPI energy index.
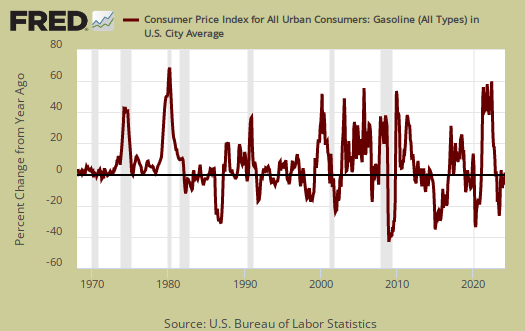
Graphed below is the CPI gasoline index as prices are now rising again.
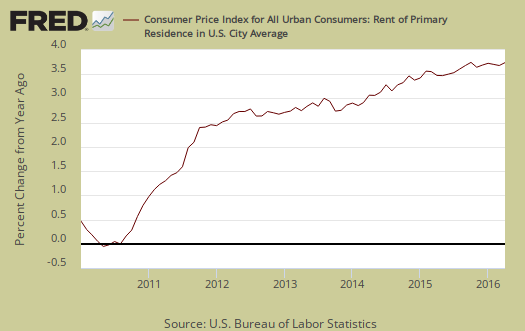
Core inflation's components include shelter, transportation, medical care and anything that is not food or energy. The shelter index is comprised of rent, the equivalent cost of owning a home, hotels and motels. Shelter increased 0.3% and is up 3.2% for the year. Rent of a primary residence just keeps increasing and this month by 0.3% and is up 3.7% for the year. Graphed below is the rent price index.
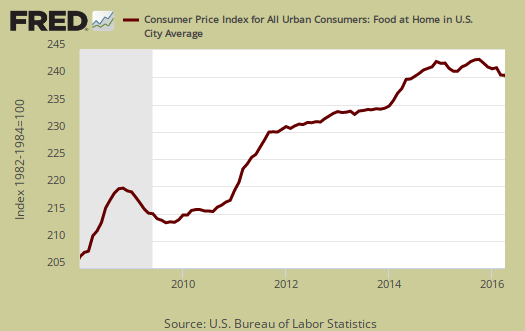
Food prices increased 0.2% for the month. Food and beverages have now increased just 0.9% from a year ago. Groceries, (called food at home by the BLS), increased 0.1% for the month, and are down -0.3% for the year. The meats, poultry, fish, and eggs index declined by -0.1% as the eggs index by itself plunged -6.3%. Eating out, or food away from home increased 0.2% for the month and is up 2.7% for the year.
Graphed below are grocery price increases, otherwise known as the food at home index.
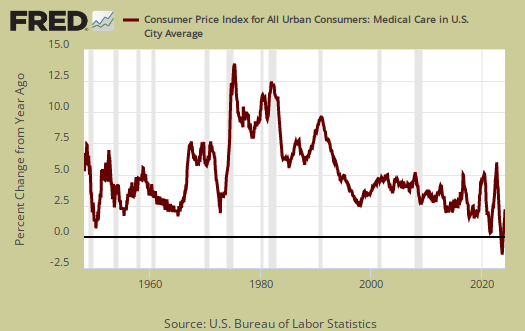
Medical care is part of core inflation. But the rate of increases is so outrageous, they need their own special attention. Medical care services were up 0.3% for the month and have increased 3.1% for the year. Graphed below is the overall medical care index, which increased 0.3% for the month and is up 3.0% from a year ago.
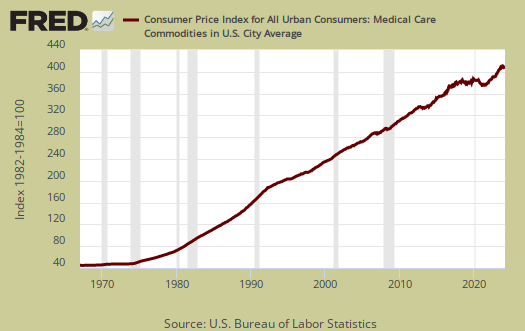
Below is a graph of the medical commodities index, which is mostly prescription drug prices. Medical commodities increased 0.5% for the month and is up 2.7% for the past year as drugs by themselves increased 0.7% for the month.
Real hourly earnings decreased by -0.1% for all employees. Real means wages adjusted for inflation. CPI increased 0.4% and wages increased by 0.3%. For the year real hourly earnings have increased 2.5%, finally just slightly staying ahead of inflation The average real hourly wage is now $10.69. Weekly real earnings increased 0.2% for the month. Real weekly earnings now stand at $368.70. Average weekly hours increased 0.1% to 34.5/wk. There is a separate category for production and nonsupervisory employees and their real hourly earnings decreased -0.2%.
CPI details
The DOL/BLS does take yearly surveys on where the money goes in the monthly budget, but as one can see, food and energy are significant amounts of the monthly finances. Run away costs in these two areas can break the bank, so can food. Additionally CPI uses substitution, so if flour goes through the roof, somehow we're all just fine with oats and prices didn't really overall increase much. Here is the BLS CPI site, where one can find much more details, information on calculation methods and error margins.
Other CPI report overviews, unrevised, although most graphs are updated, are here. If you're wondering why the graphs display different figures from the text, the graphs calculate percentages from the index and do not round. The actual data from the BLS report does round to one decimal place. In other words, 0.05% is rounded to 0.1%.
April real retail sales up 1.0% from Q1
with this release, we can now attempt to estimate the economic impact of the retail sales figures from last week, which saw nominal sales rise 1.3%...for the most accurate estimate, and the way the BEA will be figuring 2nd quarter GDP at the end of July, we would have to take each type of retail sales and adjust it with the appropriate change in price to determine real sales; for instance, April's clothing store sales, which rose by 1.0% in dollars, should be adjusted with the price index for apparel, which indicated prices were down by 0.3%, to show us that real retail sales of clothing were actually up by 1.3% in April...then, to get a GDP relevant quarterly change, we'd have to compare such adjusted real clothing sales for April with the similarly real clothing consumption for the 3 months of the first quarter, January, February and March, and then repeat that process for each other type of retailer, obviously quite a tedious task to undertake manually....the short cut we usually take to get a ballpark estimate of real sales is to apply the composite price index of all commodities less food and energy commodities, which was down 0.1%, to retail sales less grocery, gas station, and restaurant sales, which accounts for nearly 70% of the aggregate sales...those sales were up by just about 1.4% in April, while their composite price index was down 0.1%, leaving real retail sales excluding food and energy sales up by roughly 1.5%...then, for the rest of the retail aggregate, we find sales at grocery stores were up 1.1% in April, while prices for food at home were up 0.1%, suggesting a real increase of around 1.0% in the quantity of food purchased for the month...next, sales at bars and restaurants were up 0.3% in dollars, and those dollars bought 0.2% less, so real sales at bars and restaurants were only up by about 0.1%...and while gas station sales were up 2.2%, gasoline prices were up 3.4%, suggesting a real decrease in the amount of gasoline sold, with the caveat that gas stations sell more than gasoline, and we don't have the breakout on that...weighing the food and energy components at roughly 30% of total retail sales, we can estimate that real retail sales in April were up slightly less than 1.3% from March…then, to get an approximation of the real adjusted changes for the 3 months of the first quarter, we check Table 9 in the pdf for the March personal income and outlays report, which shows real sales of goods were down 0.2% in March and down 0.6% in February....that means real, inflation adjusted April retail sales were 1.1% higher than those of February but only 0.5% higher than those of January....that still leaves real retail sales at an average of 1.0% greater than those of the first quarter, which is growth at annual rate of more than 4.0%, a pace which if continued throughout May and June, would add roughly 0.96 percentage points to 2nd quarter GDP...
rjs