
The Consumer Price Index increased 0.1% in March as energy prices increased for the first time since November. Gasoline by itself increased 2.2% for the month. Inflation without food or energy prices considered increased 0.1% with shelter and medical costs once again leading the charge. From a year ago overall CPI has increased 0.9%, which is very low. Yet, without energy and food considered, prices have increased 2.2% for the year. Overall CPI in February declined by -0.2% and January had no change. CPI measures inflation, or price increases.

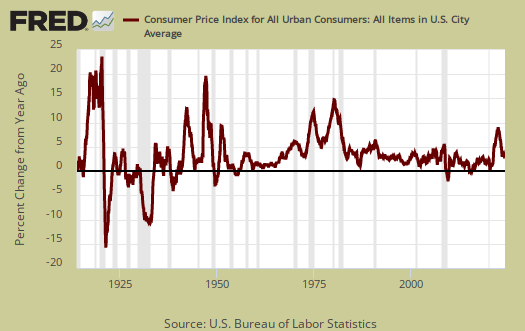
Yearly overall inflation is shown in the below graph and cheap gas has really caused overall inflation to appear very tame.
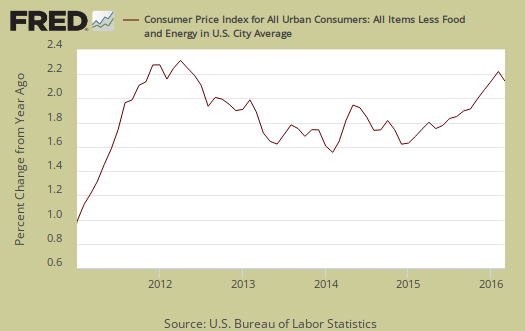
Core inflation, or CPI with all food and energy items removed from the index, has increased 2.2% for the last year. This is above typical inflation target rates of 2.0%. For the past decade the annualized inflation rate has been 1.9%.
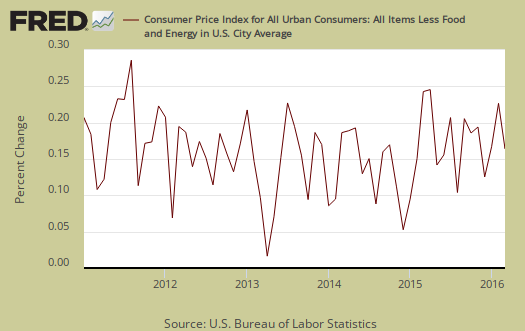
Core CPI's monthly percentage change is graphed below. This month core inflation increased 0.1%. Within core inflation, shelter increased 0.2%, with monthly rental costs increasing more than home ownership, 0.3% vs. 0.2%. Apparel prices fell by -1.1% after increasing 1.6% in February. Used cars decreased by -0.1%, new vehicles prices were unchanged while airfare declined by -0.9% for the month.
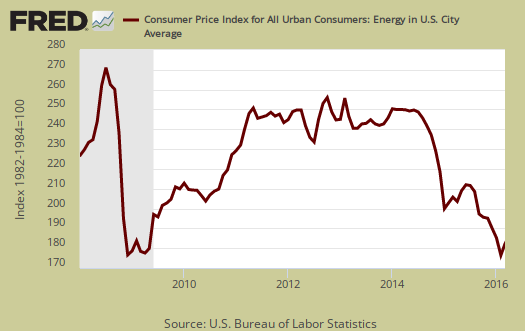
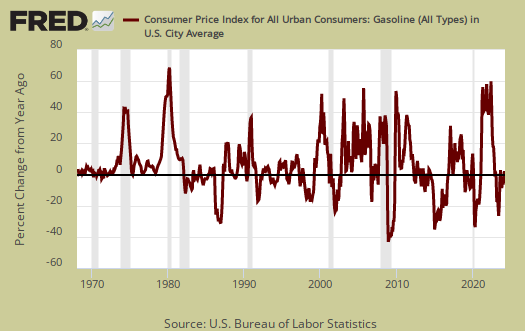
The energy index is down by -12.6% from a year ago. The BLS separates out all energy costs and puts them together into one index. For the year, gasoline has declined -20.9%, while Fuel oil has dropped -34.8%. Fuel oil for the month increased 1.7%. Natural gas declined by -0.7% for the month. Graphed below is the overall CPI energy index.
Graphed below is the CPI gasoline index and it's very happy, astounding implosion.
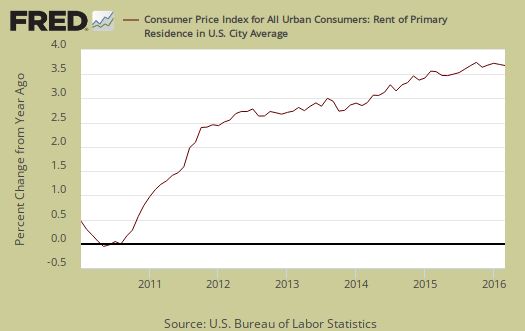
Core inflation's components include shelter, transportation, medical care and anything that is not food or energy. The shelter index is comprised of rent, the equivalent cost of owning a home, hotels and motels. Shelter increased 0.2% and is up 3.2% for the year. Rent of a primary residence just keeps increasing and this month by 0.3% and is up 3.7% for the year. Graphed below is the rent price index.  :Rent is regional and in some cities protests are breaking out as people are subject to no cause evictions and rents skyrocket monthly.
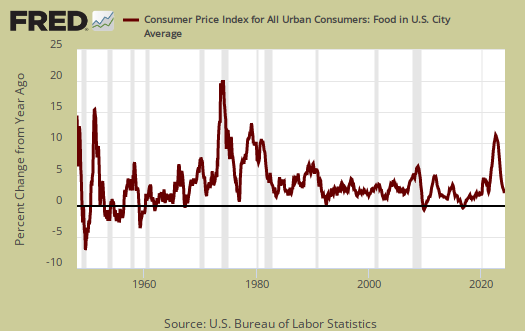
Food prices overall declined by -0.2% for the month. Food and beverages have now increased just 0.8% from a year ago. Groceries, (called food atnbs home by BLS), dropped -0.5% for the month, and are down -0.5% for the year. The fruits and vegetables index dropped by -1.9% and this is the largest monthly decline since January 2005. Veggies by themselves declined -3.2% and fresh fruit dropped by -1.7%. Yet it is other fresh fruits causing the decline as Apples increased 1.6% for the month and are up a whopping 11% for the year. Tomatoes on the other hand, classified as a vegetable instead of the fruit that it is, declined by -7.2% for the month. Beef steak increased 1.6%, roasts 2.2% but are finally down annually -2.0% for steak and -3.3% for roasts. Ground beef had no change and is down by -8.8% for the year. Eating out, or food away from home increased 0.2% for the month and is up 2.7% for the year. One really needs to drill down in these indexes to see what exactly is causing the price change as one cannot eat lettuce alone for long.
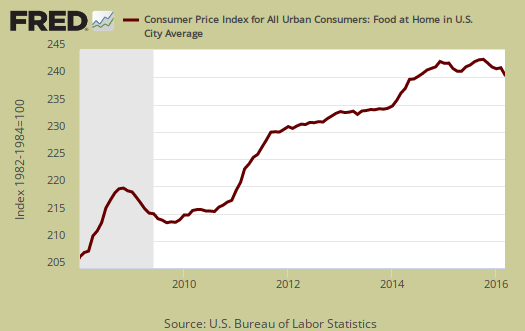
Graphed below are overall grocery prices, otherwise known as the food at home inflation index.
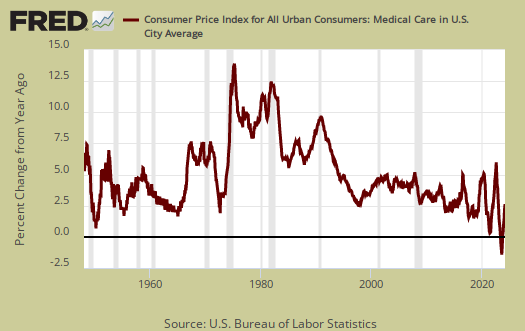
Medical care is part of core inflation. But the rate of increase is so outrageous, medical costs deserve special attention. Medical care services were up 0.1% for the month and have increased 3.6% for the year. Graphed below is the overall medical care index, which increased 0.1% for the month and is up 3.3% from a year ago.
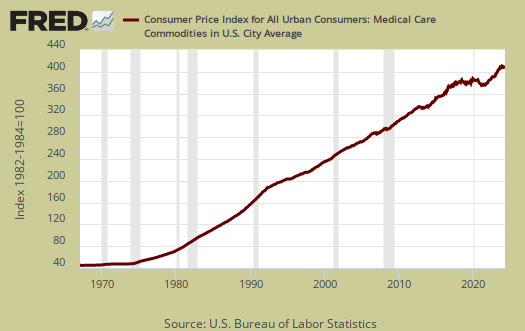
Below is a graph of the medical commodities index, which is mostly prescription drug prices. Medical commodities increased 0.3% for the month and is up 2.4% for the past year. Prescription drugs prices by themselves have increased 0.5% for the month and are up 3.6% for the year.
Real hourly earnings increased by 0.2% for all employees. Real means wages adjusted for inflation and since CPI increased by 0.1% and wages increased by 0.3%, real wages increased by 0.2%. For the year real hourly earnings have increased 1.4%, now staying ahead of curve for inflation but assuredly not for rent and buying a home. The average real hourly wage is now $10.69. Weekly real earnings increased 0.2% for the month. Real weekly earnings now stand at $367.68. Average weekly hours did not change for the month and are 34.4/wk. There is a separate category for production and nonsupervisory employees and their real hourly earnings were unchanged implying all of the gains went to the top. Their real hourly wage is $9.21, with a work week of 33.6 hours and a real weekly wage of $309.51. For the year nonsupervisory and production employees real hourly wages have increased 1.8%.
CPI details
The DOL/BLS does take yearly surveys on where the money goes in the monthly budget, but as one can see, food and energy are significant amounts of the monthly finances. Run away costs in these two areas can break the bank, so can food. Additionally CPI uses substitution, so if flour goes through the roof, somehow we're all just fine with oats and prices didn't really overall increase much. Here is the BLS CPI site, where one can find much more details, information on calculation methods and error margins.
Other CPI report overviews, unrevised, although most graphs are updated, are here. If you're wondering why the graphs display different figures from the text, the graphs calculate percentages from the index and do not round. The actual data from the BLS report does round to one decimal place. In other words, 0.05% is rounded to 0.1%.
Recent comments