
New Orders in Durable Goods, advance report, increased +0.2% for April 2012. March durable goods new orders were revised, from -4.2% to -3.7%.
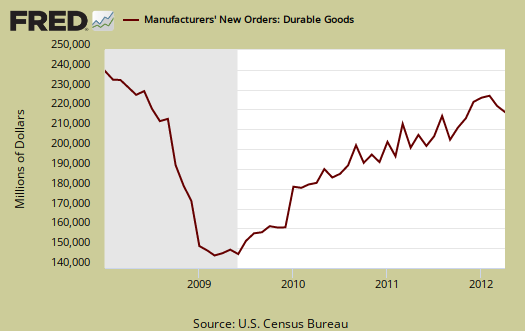
This month nondefense aircraft & parts new orders increased 7.2%. Last month's cliff dive in new orders was due to volatile non-defense aircraft and parts, which declined -46.6% in March.
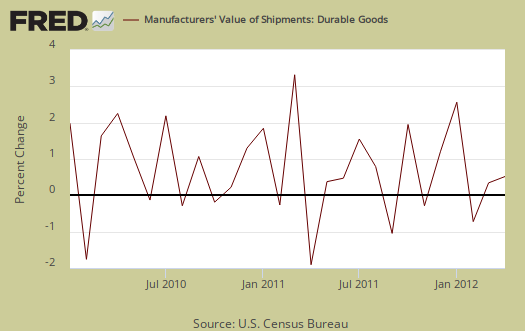
Shipments overall increased 0.7% from March and bear in mind new orders are not necessarily shipped the next month an order is made. Below is the monthly percent change for all durable goods shipments.
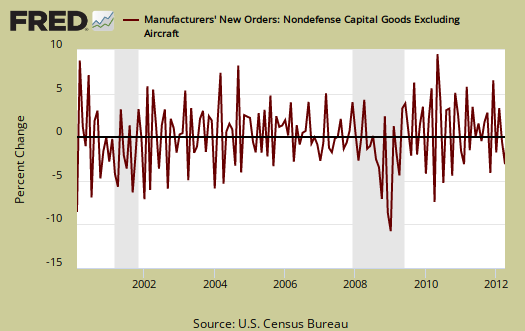
Core capital goods new orders decreased -1.9%, after decreasing -2.2% in March. Core capital goods is an investment gauge for the bet the private sector is placing on America's future economic growth and excludes aircraft & parts and defense capital goods. Capital goods are things like machinery for factories, measurement equipment, truck fleets, computers and so on. Capital goods are basically the investment types of products one needs to run a business. A decline in new orders indicates businesses are not reinvesting in themselves. Communications equipment nosed dived with a -16.9% decline in new orders. Computers declined -3.1% and Machinery dropped -2.8%. Defense capital goods really slammed down with a -21.5% drop in new orders for the month.

For all transportation equipment, new orders increased +2.1%, and this includes volatile aircraft. Motor vehicles alone had a +5.6% increase in new orders. Below is a graph of all transportation equipment new orders.

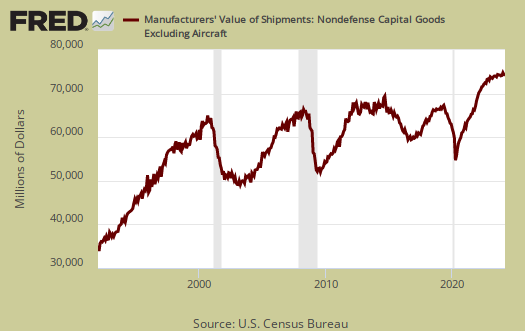
Shipments in core capital goods decreased -1.4%. Machinery is a large part of core capital goods and machinery shipments decreased -2.6% for the month.
To put the monthly percentage change in perspective, below is the graph of core capital goods new orders, monthly percentage change going back to 2000. Looks like noise right? In January 2009, core capital goods new orders dropped -9.9% and also declined by -9.4% in December 2008.
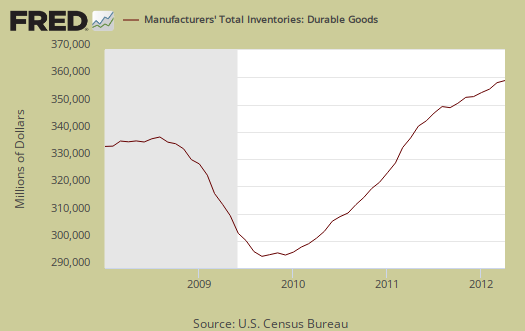
Inventories, which also contributes to GDP, are at an all time high and up 0.3% for April after increasing 0.4% in March. Inventories have been at all time highs for months and have increased for 28 months in a row. Core Capital Goods inventories increased 0.9%. Probably something that isn't too swank, machinery inventories increased 1.7% and this is the highest increase in the series NAICS history. The reason this isn't too swank is inventories can build up due to manufacturer's expectations of increased sales, or a sudden new order surprise as in not as many new orders as expected, thus goods accumulate. That's when manufacturers will slow down production to try to reduce inventories sitting on their warehouse shelves.
Unfilled orders decreased -0.1% from March, with core capital goods unfilled orders increasing by +0.2%.
Core shipments contributes to the investment component of GDP. Producer's Durable Equipment (PDE) is part of the GDP investment metric, the I in GDP or nonresidential fixed investment. It is not all, but part of the total investment categories for GDP, usually contributing about 50% to the total investment metric (except recently where inventories have been the dominant factor).
Producer's Durable Equipment (PDE) is about 75%, or 3/4th of the durable goods core capital goods shipments, in real dollars, used as an approximation.
Below is the national accounts description of PDE:
Nonresidential PDE consists of private business purchases on capital account of new machinery, equipment such as furniture, and vehicles (except for personal-use portions of equipment purchased for both business and personal use, which are included in PCE), dealers' margins on sales of used equipment, and net purchases of used equipment from government agencies, from persons, and from the rest of the world.
The below graph might give a feel for what kind of investment component we might see on PDE for Q2 GDP. This is the monthly percentage change of nominal values, not real, not adjusted for inflation, for core capital goods shipments. We can see Q2 isn't getting off to a great start, but then past quarters haven't either.

What is a durable good? It's stuff manufactured that's supposed to last at least 3 years. Yeah, right, electronics, laptops and cell phones and crappy printers, refrigerators that break in a matter of months. Regardless, that's the definition.
Here is last month's overview, not revised, although the graphs are. One might get a sense of how strongly the durable goods report is revised as more data comes into the Census bureau.
durable goods, this report was revised, from 0.2% to 0% change
See factory orders for updated data. The graphs in this report are already updated by the text is from the advance release.
I might stop covering this release since it is so often revised only a week later.
Because of that this is just another market fast food buzz versus solid macroeconomic indicators.
We are no longer going to cover Durable Goods, advance report
The reason is Durable Goods advance report is very often revised and a second release is 6 days later, and much more accurate. While advanced durable goods shows a 1.1% increase, it's just a waste of time to feed the Wall Street buzz machine when odds are in 6 days this percentage will be revised.
So, folks reading our coverage on Durable goods, we will make a point to go into much more detail on the overall Manufacturers' Shipments, Inventories, and Orders Census report, which is released on July 3rd.