
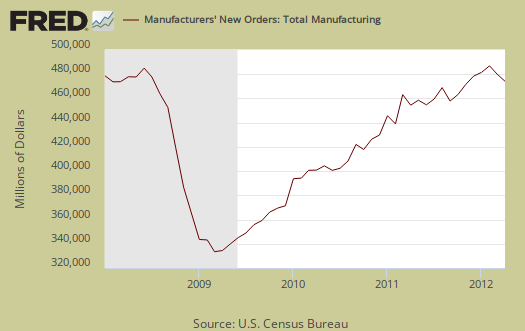
The Manufacturers' Shipments, Inventories, and Orders report shows an April -0.6% decline in new orders after March's -2.1% new orders decline. This report is called Factory Orders by the press and covers both durable and non-durable manufacturing orders, shipments and inventories. Additionally, manufactured durable goods new orders, released last week, was just revised down to zero, from an originally reported 0.2% increase. April's factory orders does not bode well for Q2 GDP growth.
Machinery led the charge in the decline where new orders dropped -2.9%. Nondurable goods new orders dropped -1.1%.
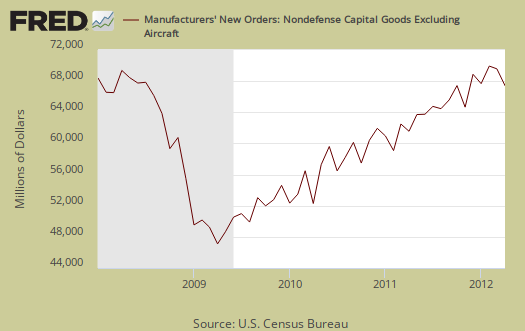
Core capital goods new orders decreased -2.1% for the month. Core capital goods are capital or business investment goods and excludes defense and aircraft.
Graphed below are the revised durable goods news orders. Notice that Durable goods new orders have still not recovered to pre-recession levels.

Shipments decreased -0.3% with core capital goods shipments decreasing -1.5%. March showed a +1.8% increase in core capital goods shipments. Below is a graph of core capital goods shipments.

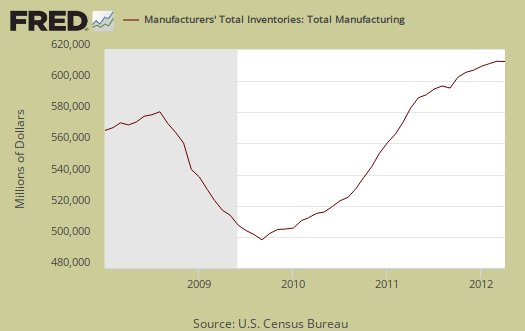
Inventories overall showed no change from March. Inventories of manufactured durable goods increased +0.3%. Machinery inventories seemed to build up, with a +1.6% increase for April. Nondurable goods inventories declined -0.5%. Petroleum and coal inventories, which are part of nondurable goods, dropped -1.6%. Core capital goods inventories as a whole increased +0.5%. There still is not an inventory build up as the inventory to shipments ratio remained the same, 1.28.
Factory orders is one of two manufacturing reports released monthly by the Census. The other report focuses on manufactured durable goods and is released earlier in the month.
Part of this report goes into GDP. The BEA takes this report, called M3, and uses the shipments values to calculate investment in private equipment, investment in software. Manufacturing inventories also goes into the changes in private inventories GDP calculation. At the bottom of this post is a little more information to estimate part of the GDP investment component.
The St. Louis Federal Reserve FRED graphing system has added individual NAICS data series from this report. If you're looking for a graph of some particular NAICS category, such as light trucks, autos & parts, or machinery, it might be found on FRED.
Recent comments