
The Manufacturers' Shipments, Inventories, and Orders report shows a May 0.7% new orders increase after two months of decline. This statistical release is called Factory Orders by the press and covers both durable and non-durable manufacturing orders, shipments and inventories. Manufactured durable goods new orders, released last week, was just revised up to 1.3%, from an originally reported 1.1% increase. April's durable goods new orders declined -0.3%. March was a durable goods blood bath, with new orders plunging -3.7%. Non-durable goods news orders increased 0.2% from April to May after last month's -1.0% decline.

Machinery alone increased 4.2% in new orders. Electrical equipments, appliances increased 2.5%. Primary metals new orders declined by -1.8%.
Transportation equipment increased 2.7% with non-defense aircraft increasing 4.9%. Defense aircraft new orders increased 6.9%. Ships & boats new orders increased 7.9%. I guess the U.S. still has a ship building industry? Motor vehicle body, parts new orders increased 1.3%. New orders for all manufacturing, minus just transportation, increased 0.4% for May.
Within nondurable goods new orders, tobacco increased 13.7%.
Core capital goods new orders increased +2.1% for the month. This is welcome news after April's capital goods new orders dropped -1.5% and March declined -2.3%. Core capital goods are capital or business investment goods and excludes defense and aircraft.

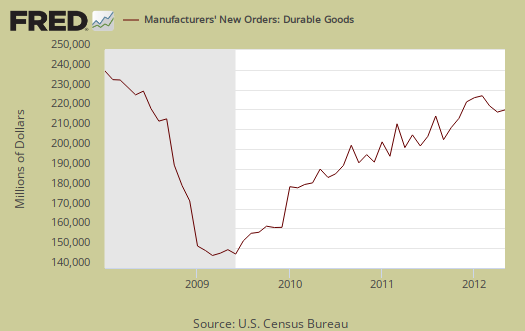
Graphed below are the revised durable goods news orders. Notice that Durable goods new orders have still not recovered to pre-recession levels.
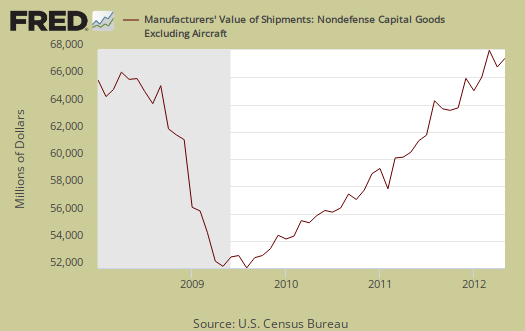
Shipments increased 0.5% with core capital goods shipments increasing 0.6%. April showed a -1.5% increase in core capital goods shipments. Below is a graph of core capital goods shipments.
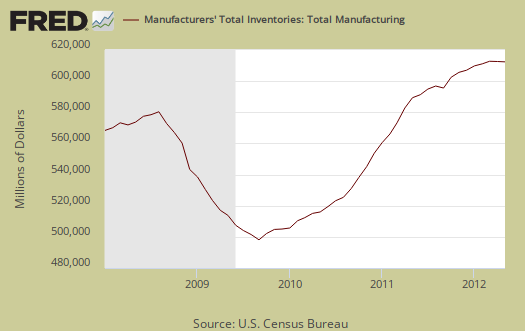
Inventories for manufacturing overall declined -0.2%. Inventories of manufactured durable goods had no change from April, but are at all time highs. Transportation equipment inventories are up 1.4% while nondurable goods inventories declined -1.2%. Petroleum and coal inventories, which are part of nondurable goods, dropped -4.3%. Core capital goods inventories as a whole increased 0.5%. There still is not an inventory build up as the inventory to shipments ratio is 1.27.
Factory orders is one of two manufacturing reports released monthly by the Census. The other report focuses on manufactured durable goods and is released 6 days earlier. Since the durable goods advance report is always revised, we focus on this release.
Part of this report goes into GDP. The BEA takes this report, called M3, and uses the shipments values to calculate investment in private equipment, investment in software. Manufacturing inventories also goes into the changes in private inventories GDP calculation. At the bottom of this post is a little more information to estimate part of the GDP investment component.
While this report is alleviating, we still have the ISM manufacturing survey showing contraction and previous manufacturing reports, including regional have plunged. Let's hope this one sticks and isn't revised down.
The St. Louis Federal Reserve FRED graphing system has added individual NAICS data series from this report. If you're looking for a graph of some particular NAICS category, such as light trucks, autos & parts, or machinery, it might be found on FRED.
Recent comments