
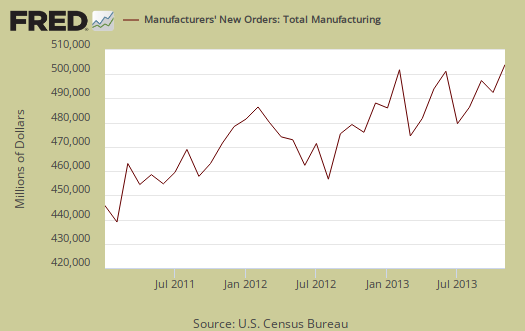
The Manufacturers' Shipments, Inventories, and Orders report shows factory new orders increased 1.8% for November. Without transportation equipment, new orders increased 0.6%. October showed a drop in factory orders by -0.5%. For Q4, factory orders are starting to shape up and the signs point to increased economic demand. The Census manufacturing statistical release is called Factory Orders by the press and covers both durable and non-durable manufacturing orders, shipments and inventories.
Transportation equipment new orders increased 8.3% , but part of the increase is volatile aircraft new orders. Motor vehicles bodies & parts new orders increase by 2.4%, whereas nondefense aircraft new orders increased 21.8%.
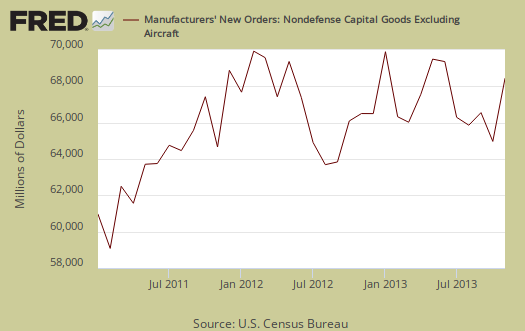
Core capital goods new orders shot up 4.1% for November after a -0.6% decrease in October. Core capital goods are capital or business investment goods and excludes defense and aircraft. This is the best news of this report and implies a positive GDP investment component for Q4 if core capital goods new orders do not plunge for December.
Nondurable goods is having a rough time with a 0.3% increase which cancels out the -0.3% change in October. Manufactured durable goods new orders, increased 3.4% for November, yet in October durable goods new orders decreased by -0.7%. Durable goods new orders was only slightly revised to a 3.4% increase from the originally reported 3.5% jump.

Shipments overall increased 1.0%, buoyed by machinery related shipments, which increased 4.3%. Nondurable goods shipments went positive, a 0.3% gain as petroleum shipments jumped by 1.4%. Core capital goods shipments jumped up by 2.7% and this is great news for economic growth. Core capital goods shipments go into the GDP calculation so the month's increase bodes well for Q4 GDP. Below is a graph of core capital goods shipments.

Inventories for manufacturing overall had no change, the same as October. Durable goods inventories increased 0.2% while nondurables decreased -0.2%. This implies the changes in inventories for Q4 GDP could go negative and detract from economic growth. This should be no surprise after the incredible run up in inventories that boosted Q3 GDP by 1.67 percentage points. Petroleum and coal inventories dropped by -1.5% for the month.

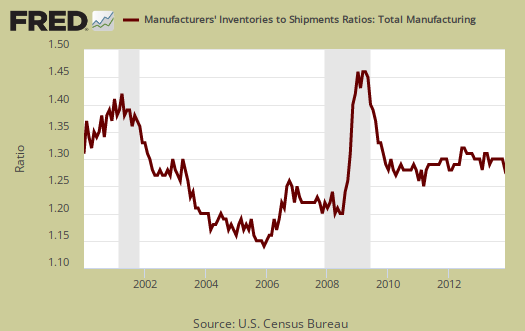
The inventory to shipments ratio decreased to 1.28. This is another sign that factory orders demand is picking up, although the ratio is still high enough to imply sluggishness, unlike when the economy is truly humming.
Unfilled Orders increased 1.0%. Core capital goods unfilled orders increased 0.9% and in durable goods increased 1.0%.
Part of this report goes into calculating GDP. The BEA takes this report, called M3, and uses the shipments values to calculate investment in private equipment, investment in software. Manufacturing inventories also goes into the changes in private inventories GDP calculation. At the bottom of this post is a little more information to estimate part of the GDP investment component.
The St. Louis Federal Reserve FRED graphing system has added individual NAICS data series from this report. If you're looking for a graph of some particular NAICS category, such as light trucks, autos & parts, or machinery, it might be found on FRED. Most news outlets source the Commerce Department, while technically correct, also makes it impossible for you, our beloved detailed reader, to find the actual statistical report and data which you might be focused in on.
There is much more detail in the statistical tables published by the Census website for manufacturing statistics.
Recent comments