
The Federal Reserve's Factory Production report shows a 0.7% increase for October 2011 Industrial Production, otherwise known as output for factories and mines. September's industrial production was revised down to -0.1% from 0.2%. Here is the Federal Reserve's detailed report.
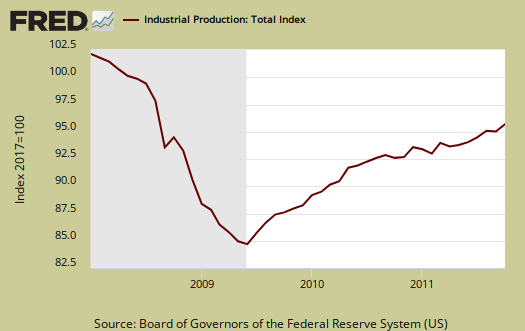
Utilities dropped another -0.1% in October. In September utilities declined -2.0%. Mining industrial production popped up 2.3% and manufacturing increased 0.5% for September. If one noticed in the trade report, non-monetary gold was 66% of the total U.S. export increase.
Total Industrial production is still down -5.3% from pre-recession levels, in other words going on 4 years, even while up 3.9% from October 2010. The Fed also reports capacity utilization, is -2.6 percentage points below the entire 1972-2010 average, but is up 2.1 percentage points from a year earlier.
Here are the major industry groups yearly industrial production percentage changes from a year ago.
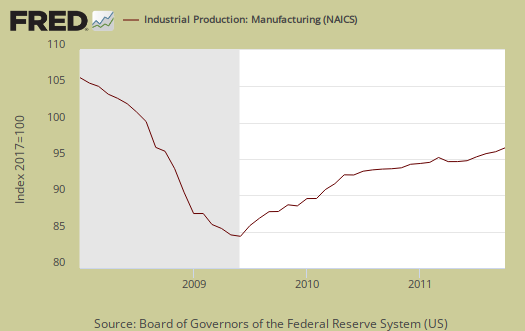
- Manufacturing: +4.1%
- Mining: +6.0%
- Utilities: +0.1%
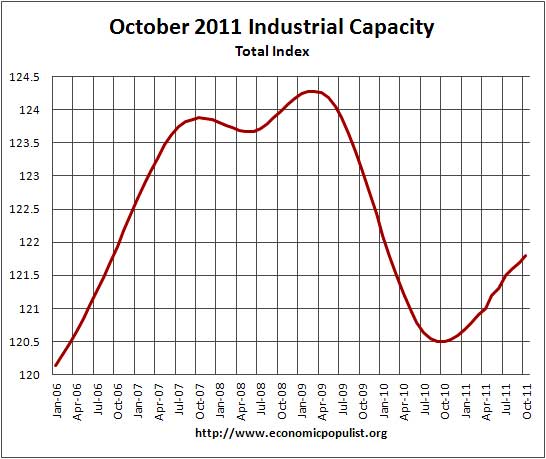
Below is the graph of raw capacity, indexed against 2007 output. This is just how much capacity does the U.S. have to make stuff. Look at how total capacity declined, for the first time in the historical data, during the recession. This index represents the raw facilities, potential to make stuff. Raw capacity is the underlying number by which utilization is calculated. This month capacity increased +0.1 and capacity growth is 1.1% for the year. We are back on the rise, but still below pre-recession levels.
Below is the Fed's description of Market groups from the report and their monthly percent changes. Considering the importance of the auto industry, what happens to manufacturing when the South Korean Trade Agreement kicks in will be interesting to watch. It is projected to flood the U.S. market with Korean autos, parts, resulting in 25,000 U.S. auto industry related jobs lost. Automotive products increased 3.9% for October and are up 12.6% since last year.
The output of consumer goods increased 0.5 percent in October. The production of durable consumer goods strengthened 2.1 percent, primarily owing to a jump in the output of automotive products. The production indexes for home electronics and for appliances, furniture, and carpeting also rose, while the output of miscellaneous goods fell slightly. The production of nondurable consumer goods was unchanged, as a contraction in the output of consumer energy products offset a pickup in the production of other nondurable consumer goods. The gain for non-energy nondurables reflected higher output for each of its major categories except paper products.
In October, the output of business equipment moved up 1.0 percent and was 10.2 percent above its year-earlier level. The index for transit equipment climbed 3.0 percent in October and has increased 22.2 percent over the past 12 months. The index for information processing equipment advanced 1.0 percent in October, its fourth consecutive monthly gain of 1.0 percent or more. The production of industrial and other equipment was unchanged in October but has risen 6.5 percent over the past 12 months.
The production of defense and space equipment increased 0.9 percent in October after having edged down 0.1 percent in September.
The index for construction supplies was up 0.1 percent in October and was little changed, on net, over the past three months. The output of business supplies slipped 0.1 percent in October, its third consecutive monthly decline. The decreases over recent months primarily reflected lower output of commercial energy products; the output of non-energy business supplies increased slightly in both September and October and edged down in August.
The index for materials to be further processed in the industrial sector gained 0.9 percent in October, which more than reversed its losses over the previous two months. The output of durable materials increased 0.4 percent last month and was up 6.4 percent from a year earlier. In October, among the major categories of durable materials, consumer parts slipped 0.2 percent, equipment parts advanced 0.7 percent, and other durable materials moved up 0.3 percent. The production of nondurable materials increased 0.3 percent; both textile and paper materials declined, while chemical materials edged up and other nondurable materials rose briskly. The output of energy materials climbed 1.9 percent and more than reversed its September decrease.
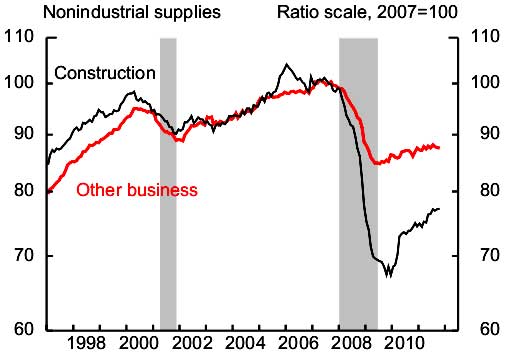
Below is the industrial production graph for construction, in black, where we can see this entire sector is still decimated after the housing bubble burst. Construction supplies increased 0.1% this month and are up 4.0% since October 2010.
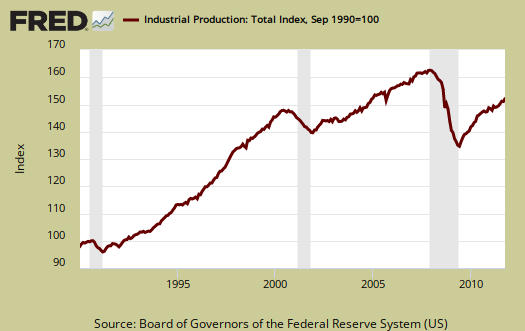
Below is another graph of industrial production since September 1990, indexed to that month. Look at the slope, the growth through the 1990's and then compare to 2000 decade. It was in 2000 when the China trade agreement kicked in and labor arbitrage of engineers, advanced R&D, I.T., STEM started in earnest.
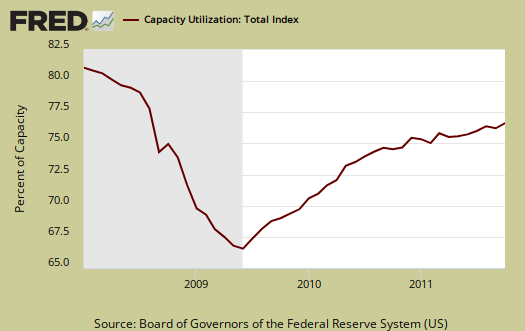
Capacity utilization, or of raw capacity, how much is being used, for total industry is now 77.8%, up 0.5 percentage points from last month. This is -2.6 percentage points below the average from 1972 to 2010, 80.4%. Capacity utilization has increased 1.1 percentage points from October 2010.
That said, mining is on fire it seems. Mining capacity utilization is now 5.3 percentage points above it's long term average to 92.7% percent for October 2011.
Below are capacity utilization's monthly percentage point change.
- manufacturing: +0.3
- mining: +2.0
- utilities: -0.2
- selected high-technology industries: -1.0
- crude: +1.5
- primary: -0.1
- finished: +0.7
Capacity utilization is how much can we make vs. how much are we currently using and this month shows signs of life, although the U.S. is still not producing what it is capable of, a reflection of the output gap. Note, this index is normalized to a specific year, currently from most reports, the 2007 yearly average (see year in the graph). Therefore, one cannot take absolute values of capacity utilization, i.e. 80%, and claim this is an indicator of a healthy economy, for it all depends on what year capacity utilization is normalized to. One can take the slope, or rate of change from the peak of a recession and determine recovery, but again, these percentages are relative, they are not absolute ratios to a static point in time. Also recall utilization is a percentage of real total capacity. Notice that total capacity in the United States has declined.
According to the report, manufacturing uses 77.8% of capacity, utilities 10.4% and mining 11.8%.
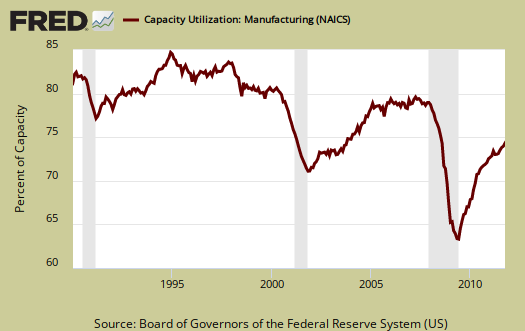
Below is the Manufacturing capacity utilization graph, normalized to 2007 raw capacity levels, going back to the 1990's. Too often the focus is on the monthly percent change, so it's important to compare capacity utilization to pre-recession levels and also when the economy was more humming.
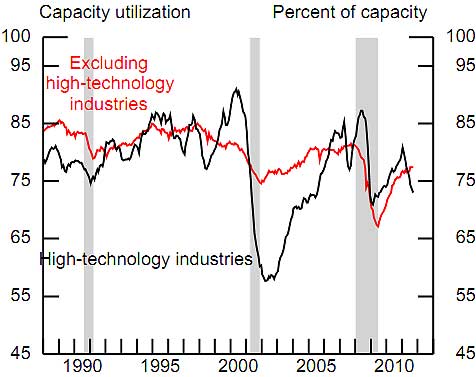
One of the more interesting graphs is high technology capacity utilization, shown below. These high tech sectors seems to correlate to when the high tech industry offshore outsourced in droves to China and communications equipment is one area that is being offshore outsourced.. High Technologies capacity utilization keeps dropping and this month was another -1.0 percentage point change.
If you are baffled by what crude, finished mean, read these stages of production definitions.
The Federal Reserve releases detailed tables for more data, metrics not mentioned in this overview.
Here is our industrial production report overview from last month, unrevised.
Recent comments