
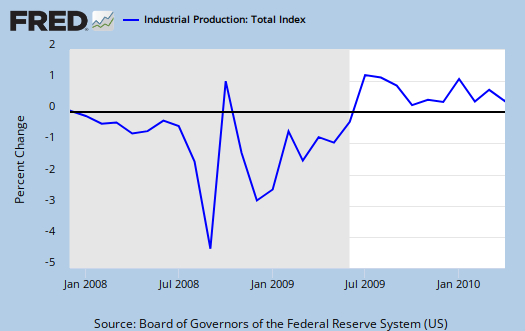
The Federal Reserve is publishing a 0.8% increase from last month in in industrial production Here is a copy of the detailed report.
The breakdown in industrial production was:
- manufacturing: +1.0%
- mining: +1.4%
- utilities: -1.3%
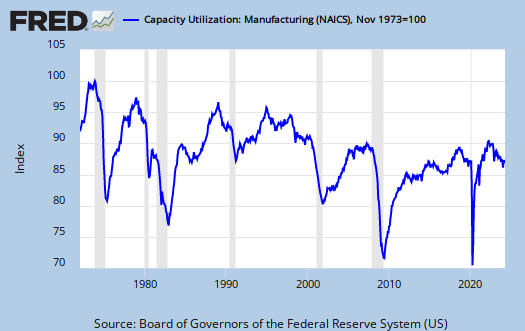
Capacity growth is -1.3% for the year and in manufacturing, -1.5%. This means the actual amount of potential facilities and ways to make stuff has dropped. Think closed factories as you drive through the Midwest. Utilities dropping just means it's getting hotter earlier, so watch that spike in the Summer when AC comes roaring on.

For industrial production the marketing group major changes are:
- Final Products: +0.5%
- Consumer goods: +0.2%
- Business equipment: +1.0%
- Nonindustrial supplies: +1.3%
- Construction: +2.8%
- Materials: +1.0%
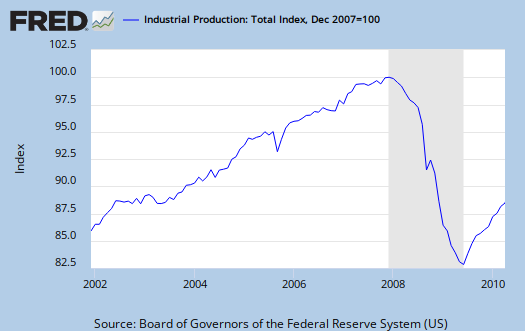
Recall percentages are all relative. Below is a graph of industrial production on a longer time period scale. As one can see it's still way below the December 2007 (start of this recession) level, but moving up, now hitting 2004 levels.

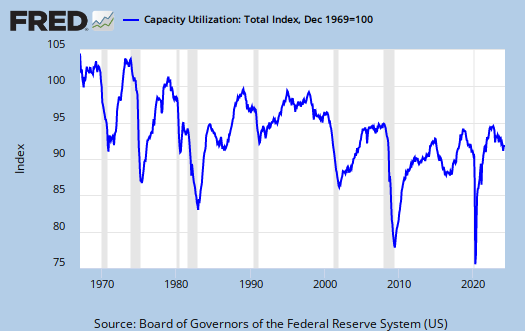
The below graphs show the overall decline of U.S. capacity utilization. These graphs show the U.S. is simply not producing what it is capable of, a reflection of the output gap.
Below is the Manufacturing capacity utilization graph. The financial press will report blow outs, so it's important to compare capacity utilization to pre-recession levels.
It's the capacity!
You continue to miss the important story here: industrial capacity continues to shrink. This is the sixteenth straight month of decline.
I don't think I missed capacity
I pointed out the drop for the year in the first paragraph below the other numbers, plus have two graphs on it. I will agree with you I need to graph out the monthly data and in all honesty, it's because I'm working on the site upgrade and the FRED in St. Louis magically doesn't have a graph of raw capacity (isn't that interesting how it is not amplified!)
So, I pledge to get the raw data graphed up soon to make it even more obvious the actual production economy continues to be hollowed out!
I'm working on that as a site feature, fast graphing of raw cvs data.
I know you've posted here previously and I'd love it if you created an account. It's a rare bird to find people who actually look at the raw data and understand it and you could really help add to the overall awareness here.
Did you see the headlines claim it's all one big blow out? ha ha. We need the blogs to analyze the data details.
I apologize. I don't know
I apologize. I don't know where my head was at.
no problems
How about creating an account and joining in? When it comes to economic indicators, the interest kind of leaves because it's stats and numbers vs. Populist rants on the big picture.