
The Federal Reserve's Factory Production report shows a -0.1% decrease, for January 2011 in Industrial Production. Here is their detailed report. December had a 1.2% increase in industrial production, revised.

Industrial Production is still below pre-recession levels, although up 5.2% from a year ago.
At 95.1 percent of its 2007 average, total industrial production in January was 5.2 percent above its level of a year earlier
The reason the numbers were not as strong as December was utilities, or energy. Think heating, oil and the weather. Utilities fell -1.6% for January. Seems those extreme cold temperatures during the blizzard did not a month make. Manufacturing, on the other hand, rose 0.3% for January and had a revised December increase of 0.9%.
Excluding motor vehicles and parts, factory production rose 0.1 percent in January. The output of utilities fell 1.6 percent in January, as temperatures moved closer to normal after unseasonably cold weather boosted the demand for heating in December; the output of utilities advanced 4.1 percent in that month. In January, the output of mines declined 0.7 percent.
Major industry groups breakdown of industrial production.
- manufacturing: +0.3%
- mining: -0.7%
- utilities: -1.6%
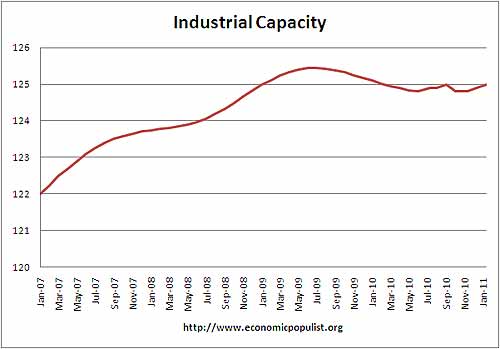
Below is the graph of raw capacity, indexed against 2007 output. This is just how much capacity does the U.S. have to make stuff. Look at how damn flat this is in terms of just raw facilities, potential to make stuff. Raw capacity is the underlying number by which utilization is calculated.
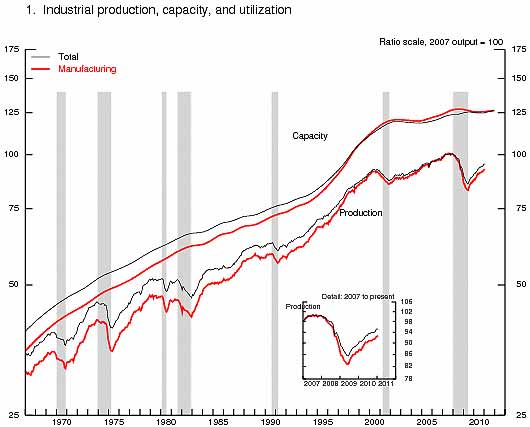
Below is the Federal Reserve graph for raw capacity and Industrial Production. Notice how at the start of 2000, when the China PNTR (trade agreement) kicked in, both literally level off to flat land. When I see this graph I think what has happened to American's industries is an absolute crime. Total capacity growth has been zero for the past year, with mining increasing 0.3% and utilities increasing 1.5%.
Below is the description of Market groups from the report and their monthly percent change. Notice Durables is doing well and check out automotive products, a 3.0% monthly increase.
The production of consumer goods increased 0.1 percent in January. The index for consumer durables advanced 1.4 percent, and the index for consumer nondurables declined 0.3 percent. Within durables, the production of automotive products rose 3.0 percent and the output of miscellaneous consumer durables gained 0.6 percent, but the index for home electronics decreased 0.8 percent and the index for appliances, furniture, and carpeting fell 1.0 percent. Among consumer nondurables, the output of non-energy goods rose 0.2 percent, as solid gains in clothing, chemical products, and paper products were partly offset by a decline in the production of foods and tobacco products. The output of consumer energy products fell 2.0 percent in January after having risen 5.4 percent in December. The decline in energy production in January reflected drops both in the production of fuels and in residential sales by electric and natural gas utilities.
The output of business equipment rose 0.9 percent in January, and all of its major component indexes increased: Transit equipment advanced 1.2 percent, information processing equipment increased 0.6 percent, and industrial and other equipment gained 1.0 percent. The output of business equipment has risen in each of the past 11 months and in January stood 11.4 percent above its level 12 months earlier.
The production of defense and space equipment moved up 1.2 percent in January after having declined, on balance, over the previous four months.
Within nonindustrial supplies, the output of construction supplies fell 0.2 percent in January, but it was 7.2 percent above its year-earlier level. The production of business supplies declined 0.3 percent; a decrease in the output of commercial energy products more than accounted for the loss.
The production of materials fell 0.4 percent in January after having risen 1.5 percent in December. A decline of 0.6 percent in nondurable materials and a decrease of 1.0 percent in energy materials were partially offset by an increase of 0.5 percent in durable materials. The gains in durable materials were widespread across its major components. Among nondurables, the index for chemical materials, which jumped 3.2 percent in December, fell 0.9 percent in January, and the indexes for textile materials and paper materials each recorded smaller declines.
- Final Products: +0.4%
- Consumer goods: +0.1%
- Business equipment: +0.9%
- Nonindustrial supplies: -0.3%
- Construction: -0.2%
- Materials: -0.4%
Below is another graph of industrial production since September 1990, indexed to that month. Look at the slope, the growth through the 1990's and then compare to 2000 decade. It was in 2000 when the China trade agreement kicked in and labor arbitrage of engineers, advanced R&D, I.T., STEM started in earnest.

Capacity utilization, or of raw capacity, how much is being used, for total industry is now 76.1%. But the Fed notes this is 4.4 percentage poitns below the average from 1972 to 2010.
Below are capacity utilization's monthly percent change breakdown.
- manufacturing: +0.2%
- mining: -0.7%
- utilities: -1.6%
- selected high-technology industries: +0.7%
- crude: -0.8%
- primary: -0.3%
- finished: +0.3%
The below graphs show the overall decline of U.S. capacity utilization. Capacity utilization is how much can we make vs. how much are we currently using. These graphs show the U.S. is simply not producing what it is capable of, a reflection of the output gap. Note, this index is normalized to a specific year, currently from most reports, the 2007 yearly average (see year in the graph). Therefore, one cannot take absolute values of capacity utilization, i.e. 80%, and claim this is an indicator of a healthy economy, for it all depends on what year capacity utilization is normalized to. One can take the slope, or rate of change from the peak of a recession and determine recovery, but again, these percentages are relative, they are not absolute ratios to a static point in time. Also recall utilization is a percentage of real total capacity. Notice that total capacity in the United States has declined.
According to the report, manufacturing uses 77.8% of capacity, utilities 10.4% and mining 11.8%.

Below is the Manufacturing capacity utilization graph, normalized to 2007 raw capacity levels, going back to the 1990's. Too often the focus is on the monthly percent change, so it's important to compare capacity utilization to pre-recession levels and also when the economy was more humming.

That said, the Federal Reserve is giving some pretty impressive growth projections for capacity over the next year:
Measured fourth quarter to fourth quarter, total industrial capacity is projected to rise 1.2 percent this year after having declined 0.3 percent in 2010. Manufacturing capacity is estimated to increase 0.7 percent in 2011 following decreases of 0.2 percent last year and 1.2 percent in 2009. Mining capacity is estimated to rise 2.0 percent in 2011 after having been unchanged in 2010, and utilities capacity is projected to expand 3.6 percent this year, which is 2.1 percentage points faster than the rate of expansion recorded last year.
Here are some more details on industrial production categories (market groups) from the Federal Reserve's report:
If you are baffled by what crude, finished mean, read these stages of production definitions.
The Federal Reserve releases detailed tables for more data, metrics not mentioned in this overview.
Here is last month's overview on industrial production.
Recent comments