
The Federal Reserve is publishing a 0.1% increase from last month in in industrial production Here is a detailed report.

The main cause for the increase was a spike in utilities, caused by hotter weather. Blast those air conditioners man. The breakdown in industrial production was:
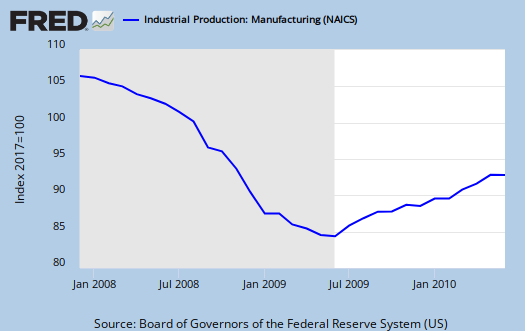
- manufacturing: -0.4%
- mining: +0.4%
- utilities: +2.7%
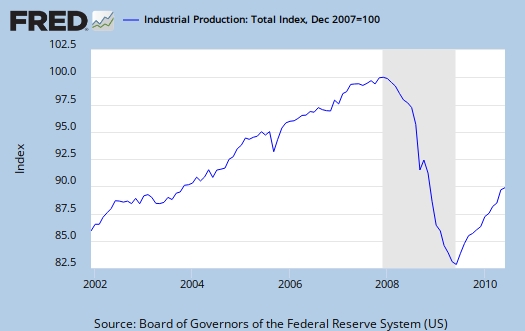
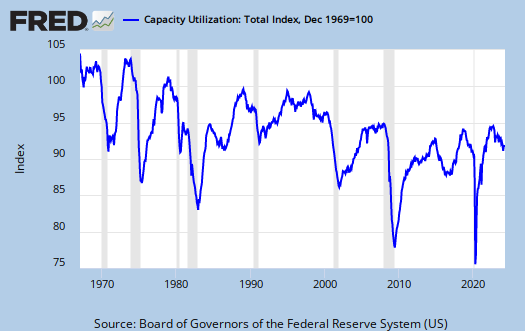
Industrial production edged up 0.1 percent in June after having risen 1.3 percent in May. The rate of change for March was revised up, and the rate of change for April was revised down; these revisions resulted primarily from the incorporation of new information on the output of utilities. For the second quarter as a whole, total industrial production increased at an annual rate of 6.6 percent. Manufacturing output moved down 0.4 percent in June after three months of gains at or near 1 percent. The output of mines rose 0.4 percent. The output of utilities increased 2.7 percent, as temperatures moved further above seasonal norms. At 92.5 percent of its 2007 average, total industrial production in June was 8.2 percent above its year-earlier level. The capacity utilization rate for total industry remained unchanged in June at 74.1 percent, a rate 5.9 percentage points above the rate from a year earlier but 6.5 percentage points below its average from 1972 to 2009.

Total capacity for the month was unchanged. Manufacturing raw capacity for the month was also unchanged, but there was a sign of hope. Advanced technologies manufacturing raw capacity was up 0.9% for the month.
For industrial production the marketing group major changes are:
- Final Products: -0.2%
- Consumer goods: -0.6%
- Business equipment: +0.9%
- Nonindustrial supplies: -0.1%
- Construction: -0.3%
- Materials: +0.4%
Below is industrial production since December, 2001. As one can see we are not near pre-recession levels. In my opinion, coming out of a trough, does not a recovery make.
Capacity utilization, or of raw capacity, how much is being used, was flat, 74.1%, after May's numbers were revised down. Below are capacity utilization's yearly percent change breakdown.
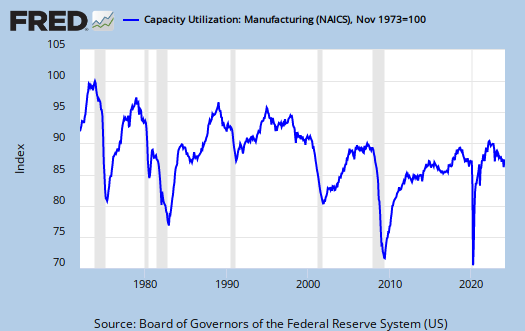
- manufacturing: -0.8%
- mining: +0.3%
- utilities: +2.3%
- crude: -0.3%
- primary: -0.8%
- finished: 0.0%
The below graphs show the overall decline of U.S. capacity utilization. Capacity utilization is how much can we make vs. how much are we using. These graphs show the U.S. is simply not producing what it is capable of, a reflection of the output gap.
Below is the Manufacturing capacity utilization graph. Too often the focus is on the monthly percent change, so it's important to compare capacity utilization to pre-recession levels.
Here is last month's report. There were major revisions to the index. Below is from the Federal Reserve Press release on what these revisions entailed.
The Federal Reserve Board released its annual revision to the index of industrial production (IP) and the related measures of capacity and capacity utilization on June 25, 2010. In this revision, the base year for the IP index was advanced from 2002 to 2007, which lowered the level of the IP index for most periods. In addition to the new base, the revised IP indexes incorporated detailed data from the 2007 Economic Census and the 2008 Annual Survey of Manufactures, both conducted by the U.S. Census Bureau. Data from selected editions of the Census Bureau's 2008 and 2009 Current Industrial Reports have also been incorporated along with annual data from the U.S. Geological Survey regarding metallic and nonmetallic minerals (except fuels) for 2008. The revised indexes reflect updated price deflators from the Bureau of Economic Analysis. For this release, monthly indicators (either product data or input data) were revised, and the estimation methods for some series were changed. The new monthly production estimates reflect the incorporation of updated seasonal factors and monthly and quarterly source data that became available (or were revised) after the closing of the reporting window. Capacity and capacity utilization were revised to incorporate data from the Census Bureau's Quarterly Survey of Plant Capacity for the fourth quarters of 2008 and 2009, which covered manufacturing, along with new data on capacity from the U.S. Geological Survey, the Department of Energy, and other organizations.
raw capacity graph
To our friendly anonymous drive by who is aware of declining raw manufacturing capacity in the U.S.
I had a rough time with a new custom graph. The data levels are not matching to the new stuff and I'm not sure exactly what's going on, so I left it out.
Bottom line it's the same as last month and I'm working on maintaining the XLS data locally so I can compare and just add. Can't jump 16 percentage points which is what I have so obviously something is wrong somewhere in the raw data I have.
I am getting the same result
Thisisnot accurate - even the previous data does not match. It is supposed to be indexed to 2007, but isn't.
06/25/10 "adjustments"
They said at the end of the release, but so far I cannot find out specifically what the "adjustments" were. They say what they incorporated but I haven't been able to chase it out.
Perhaps someone can email them to publish these adjustments to show the differential.
I also noted from last month, my raw capacity numbers were not matching the report and that's before these adjustments.
I also find it strange they do not amplify raw capacity. I mean, yeah sure utilization is key but that's a percentage and if you reduce the raw, then utilization isn't going to look so bad.
Hey, I geek out on these reports daily, so if you are also, consider getting an account. I know these get read widely but it would be nice to see some feedback, make sure I'm not doing a typo or hitting the wrong key somewhere. ;)
raw industrial capacity graph, "adjustments" significant!
I made and added a raw industrial capacity graph and this time amplified the fact industrial capacity has declined for the first time.
Jesus, I find even getting the data and then moving to in order to graph it a pain (unlike St. Louis Fred/Fed) but the numbers do match.
I think this adjustment is a story in and of itself though because we went from about 138 in raw capacity to about 124 in the adjustments (these are not exact here).
Look at the May 2010 report.
So, basically that's a massive shrinking of the economy by these new adjustments.
Makes me wonder on the stats themselves. If you are writing (you've obviously analyzing and I don't know if you are the same person who harps on raw capacity), but either one of you, I hope you register on the site and consider doing a post on this, for no one out there in MSM/blogger land seemed to notice the dramatic number shifts here.