
The September 2013 Federal Reserve Industrial Production & Capacity Utilization report shows a 0.6% increase in industrial production. Manufacturing alone barely grew, a 0.1% gain for the month, while utilities roared up by 4.4% after falling for five months in a row. Mining increased 0.2%. Industrial production finally reached pre-recession levels this month. The G.17 industrial production statistical release is also known as output for factories and mines. The graph below shows industrial production index.

Total industrial production has increased 3.2% from a year ago. For the first time, finally, industrial production is equal to 2007 levels for the total index. That is six years. Here are the major industry groups industrial production percentage changes from a year ago.
- Manufacturing: +2.6%
- Mining: +6.6%
- Utilities: +2.5%
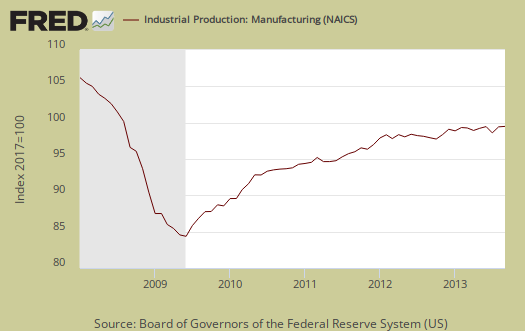
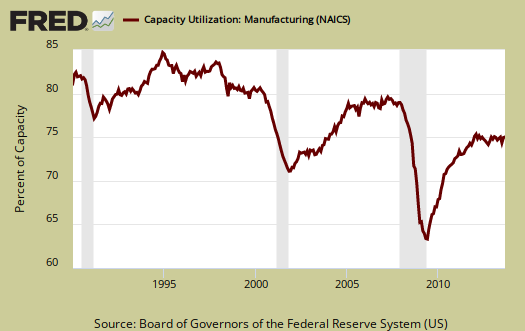
Manufacturing output alone shows a 0.1% monthly change, yet is still 4.0 percentage points below it's 2007 level average. Generally speaking factory output is by no means healthy. Below is a graph of just the manufacturing portion of industrial production.
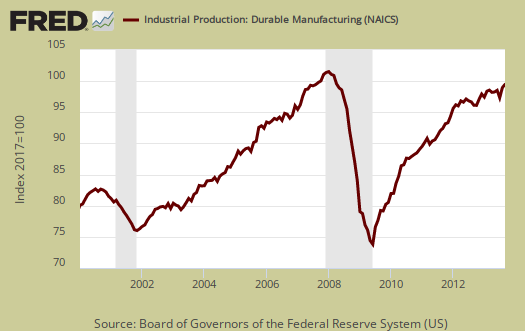
Within manufacturing, durable goods increased 0.5% for the month and the growth was 2.7%, annualized, for Q3. Motor vehicles & parts output is alive, with a 2.0% monthly gain after August's 5.2% gain. Machinery also had a good month with a 1.5% increase.
Nondurable goods manufacturing decreased by -0.3%, This is the third month in a row for nondurable goods output to decline. Nondurables also had a bad quarter, with an annualized decline of -0.3% for Q3. Printing and support had their largest decline on record, -1.1%. Seems the paperless society is potentially hitting the printing industry hard.

Mining has really grown in the United States, primarily on oil and gas extraction and this month is no exception, with a 0.2% monthly increase and mining output has increased for six months in a row. Mining is also fueling the North Dakota economic miracle.

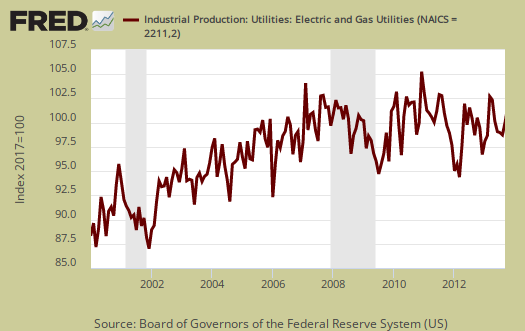
Utilities shot back up, which is a potentially good sign for the overall economy. Generally speaking utilities have been on the decline, yet the reason it might be a good sign for the economy is businesses utilize utilities. Utilities can also be impacted by unusual weather and as we can see in the below graph, utilities generally swing on a month to month basis.
There are two reporting methodologies in the industrial production statistical release, market groups and industry groups. Market groups is output bundled together by market categories, such as business equipment or consumer goods. Industrial output is by NAICS codes and is for all manufacturing, or all types of durable goods manufacturing*. Below is the Fed's description of Market groups from the report and their monthly percent changes. Looks like automotive is the bright spot in the otherwise ho hum industrial production figures.
The production of consumer goods increased 0.8 percent in September but declined at an annual rate of 1.1 percent for the third quarter as a whole. The index for durable consumer goods advanced 0.7 percent in September, as a gain in the output of automotive products more than offset declines in the production of home electronics; appliances, furniture, and carpeting; and miscellaneous goods. The output of durable consumer goods increased at an annual rate of 2.1 percent for the third quarter as a whole. The production of nondurables rose 0.9 percent in September. The increase was driven by a gain in the output of energy products, which moved up 3.9 percent, while the output of non-energy nondurables decreased 0.2 percent, a third consecutive monthly decline. Within non-energy nondurables, the indexes for foods and tobacco and for chemicals both declined 0.3 percent. In contrast, the output of clothing increased 1.6 percent and was 4.5 percent above its September 2012 level. The output of nondurable consumer goods decreased at an annual rate of 2.0 percent for the third quarter as a whole.
The output of business equipment moved up 1.2 percent in September and increased at an annual rate of 1.2 percent for the third quarter as a whole. All major categories of business equipment advanced in September. The production of transit equipment increased 2.3 percent and was 5.5 percent above its year-earlier level; the output of industrial and other equipment rose 1.2 percent in September, its first monthly gain since June; and the index for information processing equipment edged up 0.1 percent in September following an increase of 1.2 percent in August. The overall index for business equipment in September was 3.7 percent above its year-earlier level.
The output of defense and space equipment rose 0.4 percent in September and was 1.8 percent above its September 2012 level. For the third quarter, the index increased at an annual rate of 4.2 percent.
Among nonindustrial supplies, the output of construction supplies moved up 0.6 percent in September, its fourth consecutive monthly increase, and advanced at an annual rate of 4.8 percent in the third quarter. The production of business supplies rose 0.7 percent in September.
The output of materials to be processed further in the industrial sector increased 0.3 percent in September and advanced at an annual rate of 4.2 percent for the third quarter. The gain in September was due to a 1.0 percent increase in the production of energy materials. For the third quarter as a whole, the index for energy materials moved up at an annual rate of 7.5 percent. The output of durable materials was unchanged in September following a gain of 1.2 percent in August. The production of equipment parts declined 0.2 percent in September, while the output of consumer parts and of other durable materials both edged up 0.1 percent. The production of nondurable materials moved down 0.4 percent in September; the indexes for textile materials and chemical materials both declined, and the index for paper materials was unchanged.
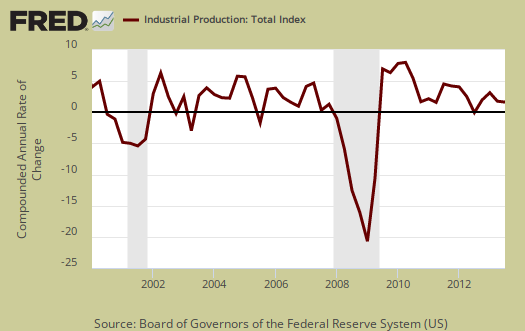
Below is graph of overall industrial production's percent change from a year ago. The Federal Reserve gives long term averages but economic malaise has been going on so long, 2008-2012 are part of those averages now.

The third quarter for Industrial production is starting to shape up to be not so bad, with an overall annualized 2.3% increase, although we can see industrial production is often revised. Industrial production does have some correlation to GDP components, but not always, so this month's change will still imply no bad news is good news for economic growth. The below graph is the industrial production index by quarters, up to Q3 2013.
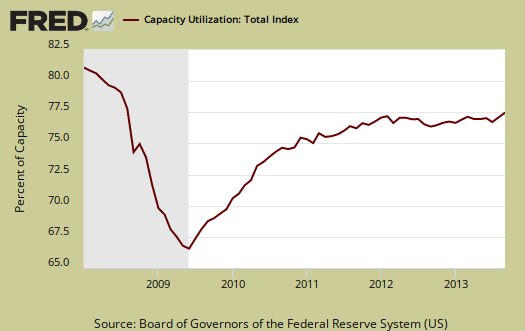
Capacity utilization, or of raw capacity, how much is being used, for total industry is 78.3%, a 0.4 percentage point monthly increase. How much plants are utilized is now 1.9 percentage points below the average from 1972 to 2012. Capacity utilization has increased 1.1 percentage points from a year ago. Manufacturing capacity utilization is now 76.1% and is 0.8 percentage points higher than a year ago. Mining capacity utilization is 90.0% and is up 2.0 percentage points from a year ago. Utilities use of it's capacity is 79.3% and this is an increase of 1.2 percentage points from a year ago. Utilities are electricity and gas and this implies those large inventories as of late which were stock piling up were not increasing in September.
Capacity utilization is how much can we make vs. how much are we currently using, of what capacity is available now, or output rate. It is also called the operating rate. Capacity utilization is industrial production divided by raw capacity.
Capacity growth is raw capacity and not to be confused what what is being utilized. Instead, this is the actual growth or potential to produce. Capacity is the overall level of plants, production facilities, and ability to make stuff, that we currently have in the United States. Capacity growth overall has increased 1.8 percentage points from a year ago, the same as the previous two months Below is the capacity growth increase from a year ago of the subcategories which make up industrial production.
- Manufacturing: +1.6%
- Mining: +4.2%
- Utilities: +1.0%
According to the report for 2012, manufacturing uses 77.4% of capacity, with durables about 39.7%. Utilities use 9.9% and mining 12.7% in 2012 (rounded) to give a ratio of manufacturing vs. mining and utilities in terms of capacity. High tech uses 3.7% of total industrial production capacity. Below is the Manufacturing capacity utilization graph, normalized to 2007 raw capacity levels, going back to the 1990's. Too often the focus is on the monthly percent change, so it's important to compare capacity utilization to pre-recession levels and also when the economy was more humming.
Here are our previous overviews, only graphs revised. The Federal Reserve releases detailed tables for more data, metrics not mentioned in this overview. If you are baffled by what crude, finished mean from the G.17 report, read these stages of production definitions. Stages of production have implications for exports and imports. Finishing industrial production implies goods for final sale and thus what kind of output one will see for the month. From the report:
Capacity utilization rates in September for industries grouped by stage of process were as follows: At the crude stage, utilization decreased 0.2 percentage point to 87.9 percent, a rate 1.6 percentage points above its long-run average; at the primary and semifinished stages, utilization rose 0.7 percentage point to 76.6 percent, a rate 4.4 percentage points below its long-run average; and at the finished stage, utilization edged up 0.1 percentage point to 75.7 percent, a rate 1.4 percentage points lower than its long-run average.
*From the Federal Reserve definition details:
Market groups consist of products and materials. Total products are the aggregate of final products, such as consumer goods and equipment, and nonindustrial supplies (which are inputs to nonindustrial sectors). Materials are inputs in the manufacture of products. Major industry groups include three-digit NAICS industries and aggregates of these industries-for example, durable and nondurable manufacturing, mining, and utilities./blockquote>
the press on industrial production
After I write up these overviews I commonly check out the overall headline buzz of the main stream press. We must be reading different reports for manufacturing has been on the bane forever, this is nothing new and overall the report doesn't indicate anything really bad as some are trying to claim. It is the typical bad America has been experiencing for over six years, nothing new.
weather
the weather plays an oversized role in utility production and hence has a big impact on the overall, even though it's only a tenth of the total...september was the 4th warmest on record, hence there was a lot of AC usage...same thing happened in March, when a much colder than normal month boosted utilities 6.4% and carried the overall index..but spring and summer were moderate otherwise, and we gave all that "production" back...watch for the same next few months if the winter is mild...
rjs