
The monthly Consumer Price Index increased 0.1% for September. CPI measures inflation, or price increases. September shows relief at the pump while steak lovers are hurting. Core inflation is below the Fed's target point. Yet while the monthly inflation number seems low, the situation is actually much more of a mixed bag, in part due to the way CPI is tabulated.

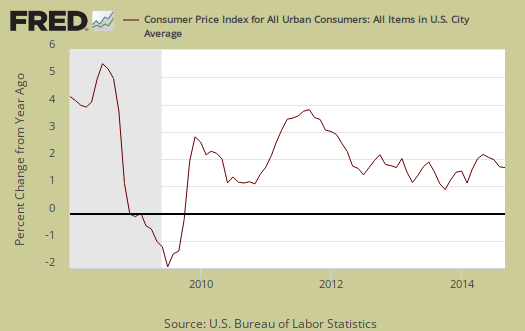
CPI has only increased 1.7% from a year ago as shown in the below graph. This is a low annual rate of inflation and the same as last month.
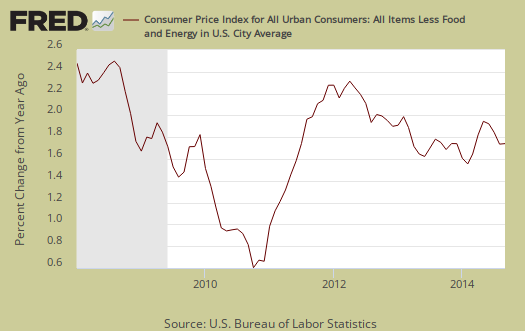
Core inflation, or CPI with all food and energy items removed from the index, increased 0.1% and has increased 1.7% for the last year. Core CPI is one of the Federal Reserve inflation watch numbers and 2.0% per year is their target rate. Graphed below is the core inflation change from a year ago
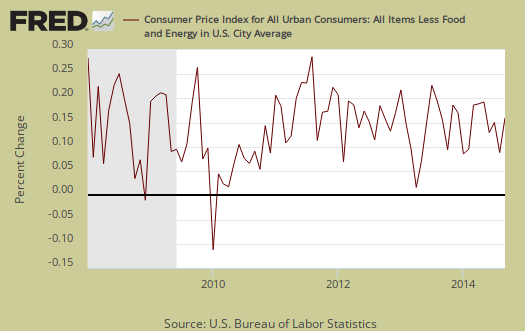
Core CPI's monthly percentage change is graphed below. Last month's decline stirred up the quantitative easing talk for deflation is a grave concern.
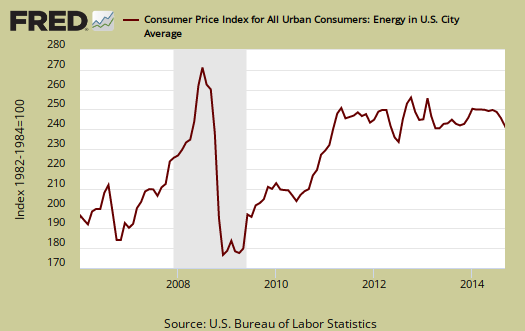
Energy overall declined -0.7% for the month and energy costs are now down -0.6% from a year ago. The BLS separates out all energy costs and puts them together into one index. This index includes gasoline which dropped -1.0% for the month and has declined now -3.6% for the year. Yet contained within the energy index is some bad news for consumers. Natural gas is now up 5.8% from a year ago with a monthly jump of 1.6%. Electricity declined -0.7% for the month and is now up 2.8% for the year. Shown below is the overall CPI energy index, or all things energy.
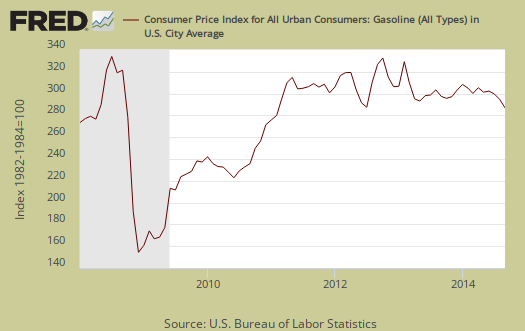
Graphed below is the CPI gasoline index only, which shows the volatility of gas prices. Gasoline was one of the better pieces of news for this report.
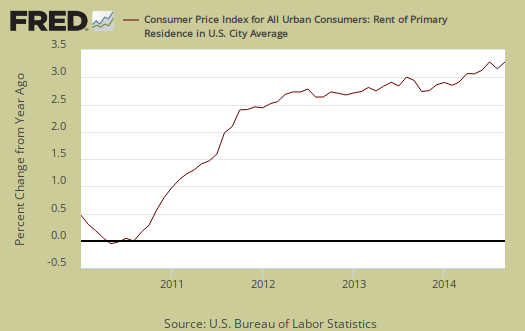
Core inflation's components include shelter, transportation, medical care and anything not food or energy. The shelter index is comprised of rent, the equivalent cost of owning a home, hotels and motels. Shelter increased 0.3% and is up 3.0% for the year. The cost of housing is clearly jumping up and considering most wages cannot afford a one bedroom apartment in many areas of the country, this is disconcerting. Rent increased 0.3% for the month, 3.3% for the year, but this is the national average. Home prices are increasing as reflected in the cost for home owners increased 2.7% for the past year as well. Graphed below is rent, where cost increases hits the people who can least afford it.
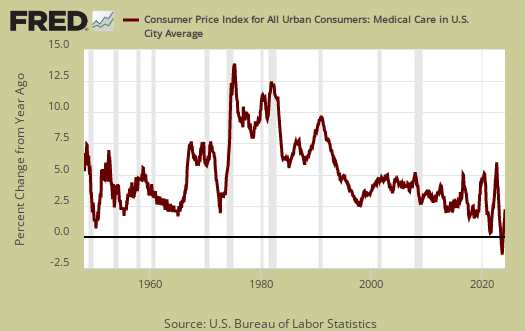
A core inflation cost which almost never drops is medical care. Medical care went back on the rise and increased 0.2% this month and has increased 2.0% over the last 12 months. Graphed below is the overall medical care index change from a year ago.
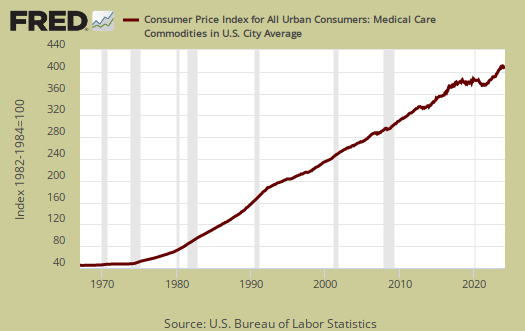
Below is a graph of the medical commodities index, which in large part consists of prescription drug prices, up a whopping 0.5% for month and 2.9% for the past year. Notice the beyond belief never ending increases since 1975 in the below graph. Television has become unwatchable due to the never ending overpriced, terrible side effects prescription drug ads, yet nothing ever stops the big pharma marketing barrage.
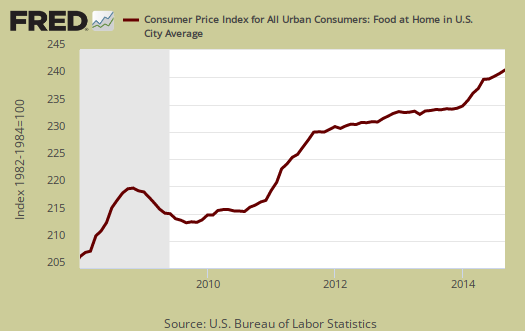
Food and beverages overall increased 0.3% and have increased 3.0% from a year ago. The food at home index, i.e. groceries, increased 0.3% for the month and 3.2% for the year. These figures are high as anyone can attest if they have walked into a grocery lately. The situation is even worse than it sounds due to the way CPI is calculated. They believe there is the ability of consumer to substitute some items for others,such as hamburger for steak. Anyone who cooks knows this is not so, yet that is what is done, so CPI is muted. Eating out, or food away from home increased 0.3% from last month and is up 2.7% from a year ago. Graphed below is the overall food index.

Graphed below is the food at home index.
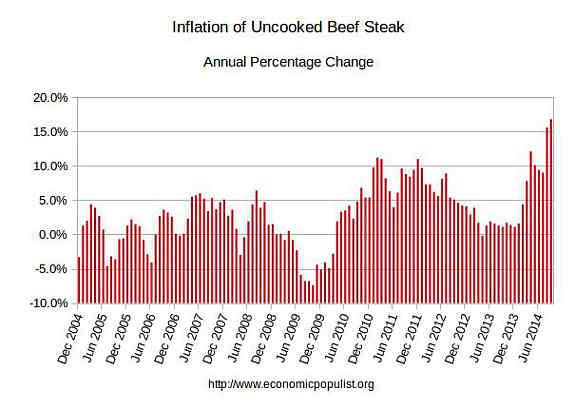
While the food inflation rate is 0.3% and 3.0% for the month, we want to point out individual food items so one gets a better feel for what is going on. Take a look at just steak and the inflation going on. Now the drought did cause beef prices to rise, but look over time, it's been increasing far greater than the inflation headline number. Right now steak prices have increased 16.8% from a year ago and that isn't even specifying grade or cut!
The BLS released real hourly earnings for September. The average hourly real wage feel -0.2% and is now $10.32. and has increased just 0.3% for the year. This means wages are not keeping up with inflation. Weekly real earnings increased by only because people were working 0.3% more hours per week.
CPI details
The DOL/BLS does take yearly surveys on where the money goes in the monthly budget, but as one can see, food and energy are significant amounts of the monthly finances. Run away costs in these two areas can break the bank, so can food. Additionally CPI uses substitution, so if flour goes through the roof, somehow we're all just fine with oats and prices didn't really overall increase much. Here is the BLS CPI site, where one can find much more details, information on calculation methods and error margins.
Other CPI report overviews, unrevised, although most graphs are updated, are here. If you're wondering why the graphs display different figures from the text, the graphs calculate percentages from the index and do not round. The actual data from the BLS report does round to one decimal place. In other words, 0.05% is rounded to 0.1%.
Natural gas is up 5.8%?
How much gas and oil production is needed to give us a "glut" and to make the US "energy independent" and to bring prices down? If the US doubled production, would the price of gas and oil be half as much? If natural gas is up 5.8% over the last year, is it because the cost to extract (equipment, taxes and wages) went up 5.8% over that time? Or is the US consuming 5.8% more than the previous year? Or is China using 5.8% more? I thought fracking was supposed to make the cost of gas and oil in the US go down. I wonder what Slim Pickens would say.
gas & oil
we have a glut of domestic gas and generally over the past couple of years the cost of producting fracked gas has exceeded the price...gas in Europe is 3 times as expensive; in Japan, it's five times as much as here...fracking continues because they've been able to pull speculative capital in and sell quantities of junk bonds...most drillers fund their operations through a combination of lines of credit, cash flow, and junk debt...with falling prices, lines of credit will dry up, cash flow will shrink and the interest on any new junk debt be that much higher...for instance, the Caa1 rated bonds for former Chesapeake CEO Aubrey McClendon's new company, American Energy Partners, fell 20% since they were issued in July...but because depletion rates on fracked wells are 80 to 90 percent over the first two years, they can't cut back and wait for better prices...to make their interest payments, they have to maintain cash flow, & to do that, they have to keep drilling...
oil is different case because oil is traded worldwide, and US prices move with international prices...the cost of producing the marginal barrel in the US is around $100, many fracking operations break even at $80...nonetheless, they're still in the same fix as those drilling for gas; they have to maintain unprofitable operations just to continue to make payments on their debt...
last week heavily indebted and over-leveraged Chesapeake Energy was forced to sell 413,000 acres with 1,500 wells in West Virginia and southwest Pennsylvania to its rival Southwestern Energy Corp for $5 billion...although this deal was probably in the works before the oil price collapse of recent weeks, the fact that they went through with it at this time at fire-sale prices indicates that their cash flow had probably dwindled to nearly nothing in the face of low gas & oil prices, and that they needed to sell these proprieties just to raise enough cash to keep their other operations running...Chesapeake's problems may be an isolated case, as it had run up $16.2 billion in debt under McClendon, while its capital spending exceeded cash flow by $47.4 billion over the last five years as gas prices collapsed, but if the low oil prices last several weeks persist through the winter, we can expect that more similarly over leveraged oil patch frackers will be squeezed in the same way...
rjs