
The December Consumer Price Index, which measures inflation, had no change, or zero from last month. This is the second month in a row for zero inflation. The flat line was caused by a -1.3% energy decrease. Gas alone decreased -2.0% in a month. Food increased 0.2%. For the year, not seasonally adjusted, the Consumer Price Index for all Urban Consumers (CPI-U) has risen 3.0%. That's the largest year to year increase since 2007. 2010 saw a 1.5% yearly increase.

New autos dropped -0.2% and used vehicles -0.9%. You can more cheaply drive a beater rust bucket while trying to pay for health care. Transportation overall, which accounts for gas, dropped -0.7%.
Shelter is up 0.2%, same increase for the last 4 months, with rent increasing 0.3%. Housing is the biggest monthly expense so this is not good news. Home owners equivalent rent of primary residence also increased 0.2% but hotels, motels dropped -0.2%.
Apparel decreased -0.1%, but clothing that baby just increased 2.1% in a month.
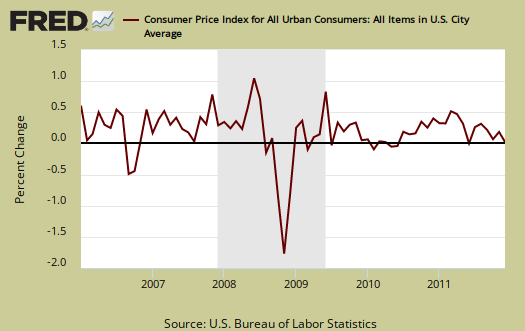
Below is the monthly percentage change in CPI-U, all items. U stands for Urban consumers. One can see how oil prices rule our lives by the monthly changes.
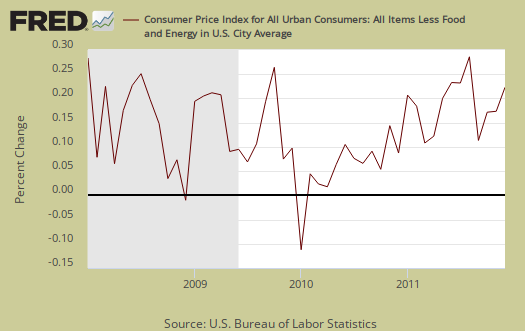
The core CPI, or all items less food and energy, percentage increase was 0.1%. November's core CPI was 0.2%. Core CPI is a Federal Reserve inflation watch number.
While core inflation is staying reasonably flat, up 2.2% for the last 12 months and the same as last month, the index had it's largest yearly increase since 2007. Core CPI's monthly percentage change is graphed below. As we can see, overall, without energy and food, inflation is still tame.
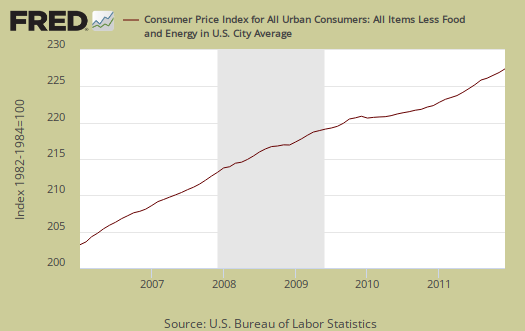
Below is the St. Louis FRED graph to show the overall index on core CPI, or CPI without food and energy included. We are seeing an acceleration uptick in core although the recession, which includes the late 2008, early 2009 time period where CPI was deflationary. 2010 saw a historic low of only 0.8% yearly increase in core inflation.
Food and beverages as well as groceries increased, 0.2% and the food index is up 4.7% for the year. Food at home, or groceries, increased 0.3%, and is up 6.0% for the year. Eating out increased 0.2%. Fats & Oils, if you can believe this, increased 1.7% for the month and are up 13.5% from a year ago. Meats just got more expensive, it increased 0.7% for the month and is up 7.9% from a year ago.
In 2010 food increased 1.5% and eating in increased 1.7%. Food getting way too expensive is not in your imagination. $9 bucks for a bad tasting frozen meal? Are you kidding me?

Energy overall decreased -1.3%, after last month's -1.6% drop. The energy index separates out all energy costs and puts them together. Energy is also mixed in with other indexes, such as heating oil for the housing index and gas for the transportation index.
The energy index is still up 6.6% for the year. 2010 saw a 7.7% increase so for this year we've got a break in comparison to last on energy prices. Gas alone decreased -2.0% for December but is still up 9.9% from this time last year, although in 2010 gas increased 13.8%. Heating your house with gas just got cheaper. Utility gas dropped another -0.8% after plunging -4.4% in November and is down -3.7% from this time last year. Household energy decreased -0.4% this month, the last decrease as last month. Fuel oils for households decreased -0.7% but is up 14.3% for the year. Seems one great subsidy would be to let people retrofit their homes from heating oil to gas at this point. Below is the CPI-U Energy Index.

Below are gas prices, last updated December 12th. Notice the oil bubble in early 2008 and notice how close gas prices are now to that previous oil bubble. This CPI report is for December but watching gas prices can gives good indicator on future inflation to come.

The CPI energy index, capturing the last oil bubble below, is all energy, gas, natural gas, fuel oil and so on. Notice it's dip and return versus the food index as well as how it's not as high as the CPI energy index was during the oil commodities bubble of 2008.

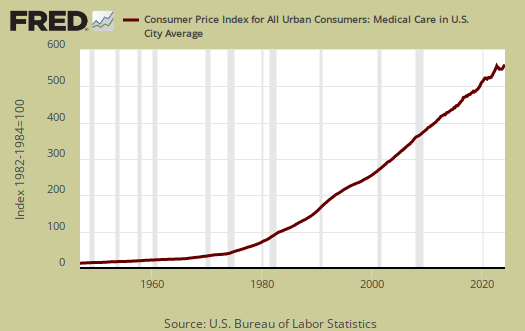
The overall Medical index increased 0.4% for the month, the same increase as last month. The medical index is up 3.5% for the year. Medical care services increased 0.4% and is up 3.6% for the year. Professional services, or Doctors increased 0.3% and is up 2.2% from this time last year. Hospitals increased 0.5% in December. Medical commodities are things like your prescription drugs and it increased 0.2% from last month and is up 3.2% for the year. Advertising costs baby. Strange isn't it, that Medical care is never mentioned when referring to costs and inflation. It's only as important as food, yet health care is treated almost like it's an extra for daily living. The reason is the importance ranking in CPI. This is because no everyone gets a serious illness at once (but lord help you if you do), so the average medical expenses spread out of the population are diluted in overall cost of living figures.
There has been much criticism as of late that the Federal Reserve only focuses in on core CPI, instead of food and energy. According to the BLS, Food and beverages, which includes food at home, makes up 14.8% of the index. Housing is 41.5% and transportation, including gas for the car, is 17.3%. Medical care is only 6.6%, they claim. All items minus food and energy are considered 77.2% of the total price expenditures for consumers.....according to them.
The DOL/BLS does take yearly surveys on where the money goes in the monthly budget, but as one can see, food and energy are significant amounts of the monthly finances. Run away costs in these two areas can break the bank, so can food.
CPI-W for the month, unadjusted was 222.166 , a zero change from last month, with a 3.2 % increase for the year. CPI-W is used to calculate government transfer payments, such as social security increases.
Last month's CPI report overview, unrevised, although most graphs are updated, is here.
If you're wondering why the graphs look weird, the graph calculates percentages from the index and doesn't round. The actual data from the BLS report does round to one decimal place. In other words, 0.05% is rounded to 0.1%.
Recent comments