
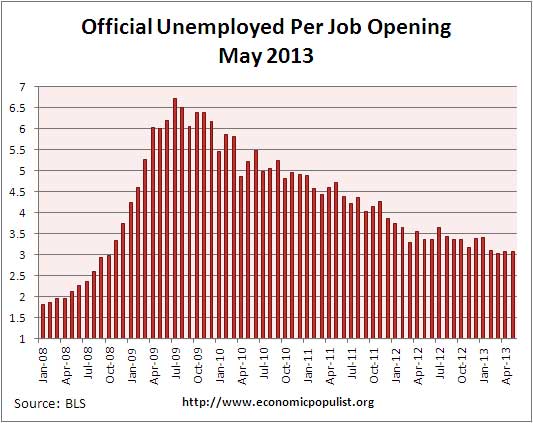
The BLS May JOLTS report, or Job Openings and Labor Turnover Survey shows there are 3.1 official unemployed per job opening, the same as the last three months. Every month it is the same story, a static dead pool job market with employers clearly not hiring and this is in spite of the revisions to jobs gained. Job openings didn't change, a measily 0.7% increase from last month to a total of 3,828,000. Hirings didn't change much either, a 1.0% change to 4.441 million. Real hiring has only increased 22% from June 2009. Job openings are still below pre-recession levels of 4.7 million. Job openings have increased 76% from July 2009. Every month JOLTS reports the same bleak labor market conditions. There is never enough actual hiring in addition to not enough openings.
There were 1.8 official unemployed persons per job opening at the start of the recession, December 2007. Below is the graph of the official unemployed per job opening. The official unemployed ranked 11.76 million in May 2013.
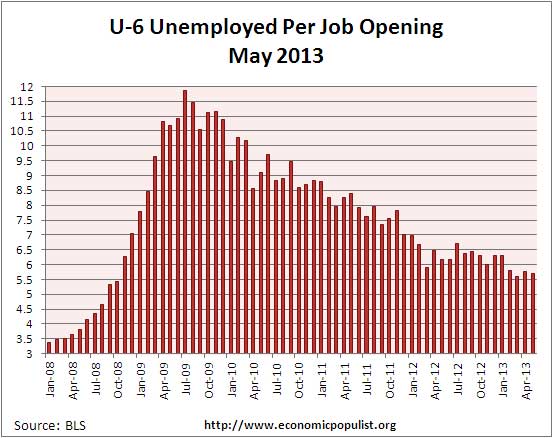
If one takes the official broader definition of unemployment, or U-6, the ratio becomes 5.7* unemployed people per each job opening. The May U-6 unemployment rate was 13.8%. Below is the graph of number of unemployed, using the broader U-6 unemployment definition, per job opening.
We have no idea the quality of these job openings as a whole, as reported by JOLTS, or the ratio of part-time openings to full-time. The rates below mean the number of openings, hires, fires percentage of the total employment. Openings are added to the total employment for it's ratio. The hires rate changes for industry sectors with currently leisure & hospitality, the lowest paying jobs of all, having the highest rates.
- openings rate: 2.7%
- hires rate: 3.3%
-
separations rate: 3.2%
- fires & layoffs rate: 1.3%
- quits rate: 1.6%
- other rate: 0.3%
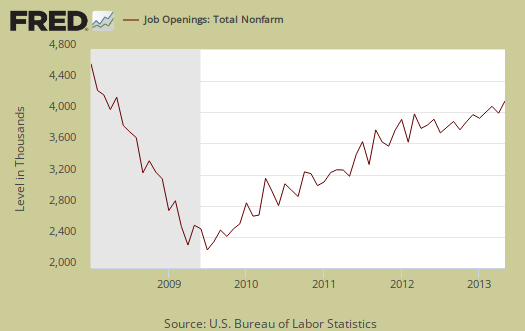
Graphed below are raw job openings. Job openings are still below the 4.7 to 4.3 million levels of 2007.
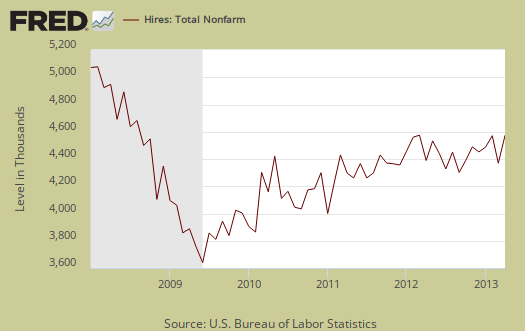
Since the July 2009 trough, actual hires per month have only increased 22%. This is simply terrible and the most important indicator in our view for employers are clearly refusing to increase hiring, across the board and thus not recover from our jobs crisis. Businesses can say there are job openings, but if they do not hire an American and fill it, what's the point? The truth is business are refusing to hire Americans and this is while profits are at roaring highs. Additionally the hires rate is lower than it was a year ago.
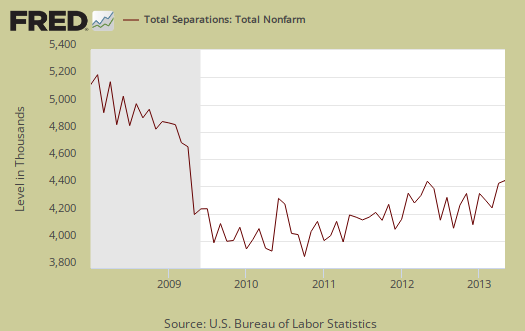
Below are total job separations, 4.323 million, also no change, a 0.8% increase from last month. The term separation means you're out of a job through a firing, layoff, quitting or retirement.
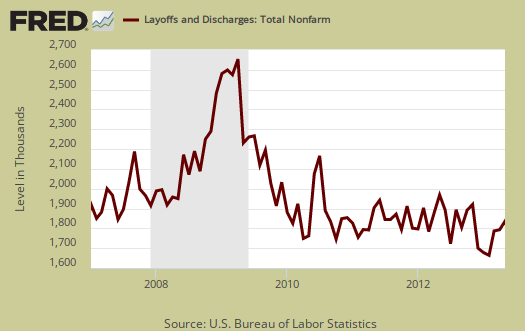
Layoffs and firings were 1.739 million, no change from last month. Below is a graph of just layoffs and firings. One can see from labor flows while businesses are not thrashing their workforce so much, they are also not adding to their payrolls.
Graphed below are openings separations and hires levels, so we can compare the types of labor flows. While layoffs have declined to pre-recession levels, it is the flat line hires (blue) that is the problem, beyond not enough job openings (red) for the unemployed. There is simply not enough hiring going on to get people back to work. Anyone who claims a labor shortage is also easily disproved by these figures. A labor shortage would imply more job openings than unemployed available to fill them.

One thing rarely mentioned in the press is the pathetic annual job gains. Permanent job gains are consistently below 2 million with these persistently high unemployment levels means the job crisis seemingly is without end and employment is not permanent. Note the contrast between the BLS payroll figures. The reason this figure is lower is labor flows. People are being separated from their jobs, so one can have job growth yet if people are then fired, by labor flows that loss results in less net employment gains.
Over the 12 months ending in May 2013, hires totaled 51.9 million and separations totaled 50.1 million, yielding a net employment gain of 1.8 million. These figures include workers who may have been hired and separated more than once during the year.
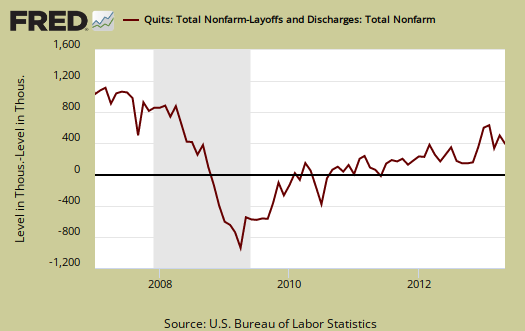
Graphed below are people who quit their jobs minus those who were fired and laid off. The lower the bar on the below graph, the worse labor conditions are. The number of quits were 2.203 million, also no change, a 0.8% increase from last month. People quit their current jobs often to obtain better ones. People feeling free enough to leave their current position also hasn't changed much for the year. Additionally quit statistics are still way below pre-recession levels of 2.8 million, although quits has increased 37% in the private sector from the September 2009 low of 1.5 million. People are clearly not voluntarily leaving their jobs because the job market is bad, even though the jobs slaughter of 2009 where people were laid off and fired in mass is over.
Below is a graph of the quits to layoffs ratio, currently at 1.27. This ratio of people who quit their jobs vs. those who were fired gives an indicator of worker churn as well as if there might be a shortage. If the ratio is below 1.0, this means more people are being laid off and fired than people who quit. When the ratio is much higher, this means more people quit their jobs and thus implies there is better opportunity elsewhere and workers feel free enough to move on. The quits to fires ratio was 1.8 in 2006. The health care and social assistance sector has remained above 1.0 in this ratio, implying there are plenty of jobs. The construction industry, on the other hand, has a quits to layoffs ratio of below 1.0, implying getting fired from your construction job is routine. Here again we see a bad labor market and people don't quit because there aren't enough better opportunities.

For the JOLTS report, the BLS creates some fairly useful graphs beyond the above and they have oodles of additional information in their databases, broken down by occupational area. That said, one doesn't know if the openings are quality jobs from the JOLTS statistics. The St. Louis Federal Reserve also had loads of graphing tools for JOLTS.
The JOLTS takes a random sampling of 16,000 businesses and derives their numbers from that. The survey also uses the CES, or current employment statistics, not the household survey as their base benchmark, although ratios are coming from the household survey, which gives the tally of unemployed.
The April 2013 unemployment rate was 7.5%. JOLTS includes part-time jobs and does not make a distinction between part-time, full-time openings. A job opening reported to the survey could literally be take out the trash twice a week and be counted. This is a shame, it would be nice to know a little more about the quality of these new opportunities. Here are our past JOLTS overviews, unrevised.
* is defined as the official unemployed plus people who are in part-time jobs for economic reasons plus the marginally attached. The marginally attached
, are officially not part of the civilian labor force,
, and also not seasonally adjusted. The above graph was created by the seasonally adjusted levels of the unemployed, part-time for economic reasons and the marginally attached, raw totals. Another way to calculate this figure is:
where
on a personal note
One may wonder why this overview was published 16 hours after the JOLTS release.
Believe this or not, I was on the phone, ALL DAY, documenting, FAXing, writing complaints finally in dealing with an insurance company trying to do a policy switcheroo on the type fthat I am paying premiums on and thus deny benefits and deny what I purchased.
While the JOTS report month after month shows the job market is truly horrific, is there anything left in America that is on the up and up? How many hours do Americans blow away fighting ripoffs and financial screw jobs?
I promise to dig out the statistics for myself, it can take weeks and weeks, but generally speaking individuals are just getting the shaft from every direction.
Unless you're connected/uber-wealthy, you don't matter
It's that simple. If you have huge gobs of cash, political connections, or even better, both, then someone in power cares. If not, sh*t out of luck. Look at the connected families that can actually win public office just by their last names. They will never worry about anything. Their kids could be the dimmest, laziest, most arrogant tools in the world, but they'll never worry about getting screwed over, fighting for jobs under poverty wages, or even busting asses in tough colleges so they can be unemployed with STEM majors. Now, the 99%+ rest of us, oh well, prepare to fight, struggle, get raped and robbed, and over and over and over again. But if some foreign or US well-connected super rich joker has a beef with a business, or professional, or insurance, or cop, or judge, or law, one phone call and it's solved. Hell, they can literally break laws, destroy people, rob, loot, flunk, steal, lie, etc., and they'll never face any difficulty or repercussions. Who says this is a democracy or republic? And our "elite" schools and institutions even invite scoundrels from overseas to screw us here. Wasn't Qaddafi's kid here on a special tour by the State Dept. as we were preparing to attack Libya? He got special visas, passes, etc. that gave him access Americans can't even get. Look at Harvard and other schools. Within their classes they have plenty of folks from here and abroad that got in through connections, nothing more. Meanwhile some poor kid on an Iowa farm busting his ass that can play the piano like an expert, score 99% on all his tests, dominate all his AP Calc. and Physics and other work will never get into those same schools and will struggle for life. But hey, I'm just a grunt too, so don't listen to me.