
The October 2011 ISM Manufacturing Survey decreased -0.8 percentage points to 50.8% PMI. While still considered expansion, this is a slowdown from last month. Below is the manufacturing composite index, PMI, still around 2008 levels.

New Orders broke a 3 month contraction and rose +2.8 percentage points to 52.4%, indicating a return to growth.
A New Orders Index above 52.1%, over time, is generally consistent with an increase in the Census Bureau's real series on manufacturing orders.

You maybe wondering how PMI could decrease when new orders popped up. PMI is a composite index on manufacturing. Here's how the ISM defines PMI:
The PMI is a composite index based on the seasonally adjusted diffusion indexes for five of the indicators with equal weights: New Orders, Production, Employment, Supplier Deliveries and Inventories.
Below is the ISM table data, reprinted, for a quick view. While new orders increased, we can see production employment, inventories, supplier deliveries all declined in October.
| Manufacturing at a Glance October 2011 | ||||||
|---|---|---|---|---|---|---|
| Index | October | September | % Point Chg. | Direction | Rate | Trend |
| PMI | 50.8 | 51.6 | -0.8 | Growing | Slower | 27 |
| New Orders | 52.4 | 49.6 | +2.8 | Growing | From Contacting | 1 |
| Production | 50.1 | 51.2 | -1.1 | Growing | Slower | 2 |
| Employment | 53.5 | 53.8 | -0.3 | Growing | Slower | 25 |
| Supplier Deliveries | 51.3 | 51.4 | -0.1 | Slowing | Slower | 29 |
| Inventories | 46.7 | 52.0 | -5.3 | Contracting | From Growing | 1 |
| Customers' Inventories | 43.5 | 49.0 | -5.5 | Too Low | Faster | 31 |
| Prices | 41.0 | 56.0 | -15.0 | Decreasing | From Increasing | 1 |
| Backlog of Orders | 47.5 | 41.5 | +6.0 | Contracting | Slower | 5 |
| Exports | 50.0 | 53.5 | -3.5 | Unchanged | From Growing | 1 |
| Imports | 49.5 | 54.5 | -5.0 | Contracting | From Growing | 1 |
| OVERALL ECONOMY | Growing | Slower | 29 | |||
| Manufacturing Sector | Growing | Slower | 27 | |||
Production, which is the current we're makin' stuff now meter, decreased -1.1 percentage points from last month to 50.1% barely above the contraction inflection point. Production correlates to the Federal Reserve's industrial production, where the October statistics will be out mid-month.

Backlog of orders popped up +6 percentage points to 47.5%, which is still in contraction.

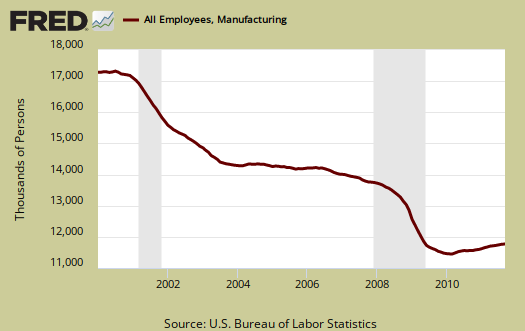
Now we come to employment, otherwise known as where are the damn jobs? The manufacturing ISM employment index decreased -0.3 percentage points to 53.5%. The neutral point for hiring vs. firing is 50.1%.
Below are the BLS manufacturing non-farm payrolls (jobs) for the past decade on the left, in red (October's numbers are out Friday), graphed against the ISM manufacturing employment index on the right, in blue. The BLS number is simply raw manufacturing jobs tally, not taking into account population growth or overall sector shrinkage as well as time lag. One can eyeball a slight correlation in the middle of the decade, yet note the divergence this recovery, starting late 2008.
Inventories decreased -5.3 percentage points to 46.7% and moved into contraction. In Q3 GDP changes in private inventories contracted and took off –1.08 percentage points from 2.45% Q3 GDP. Manufacturing's customer inventories also decreased -5.5 percentage points to 43.5%.

U.S. manufacturing exports new orders declined -3.5 percentage points to 50.0%. China's PMI dropped to a 3 year low in October and since China seems to be the globe's favorite place to offshore outsource jobs, this implies a global manufacturing slowdown. The U.K's PMI also dropped like a stone to a 28 month low.

Imports decreased -5.0 percentage points to 49.5% and also moved into contraction. These are materials manufacturers use to make their products.
Prices cliff dived -15 percentage points to 41.0% and is the 6th consecutive month prices have been below 80 since December 2010, and this is the first month prices have been below the ISM inflection point. The prices index hasn't been this low since contraction since May 2009. Prices are what manufacturers pay to make their products.

Here is the ISM growth and contraction sector ordered list:
Of the 18 manufacturing industries, eight are reporting growth in October, in the following order: Computer & Electronic Products; Petroleum & Coal Products; Food, Beverage & Tobacco Products; Nonmetallic Mineral Products; Primary Metals; Fabricated Metal Products; Paper Products; and Machinery. The six industries reporting contraction in October — listed in order — are: Plastics & Rubber Products; Chemical Products; Apparel, Leather & Allied Products; Printing & Related Support Activities; Electrical Equipment, Appliances & Components; and Miscellaneous Manufacturing.
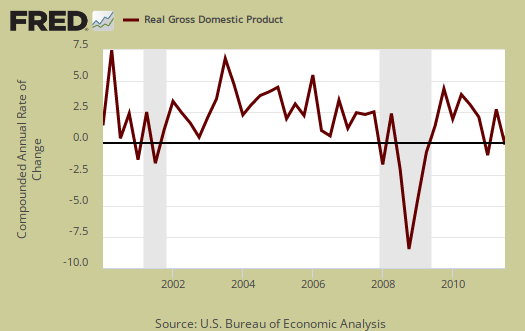
The ISM has a correlation formula to annualized GDP, but they are now noting the past correlation. Annualizing October's data, the ISM get a 2.9% 2011 annual GDP.
The ISM neutral point is 50. Above is growth, below is contraction, although the ISM is this report is noting some variance in the individual indexes. For example, A PMI above 42, over time, also indicates growth.
Last month PMI was 51.6%. The graphs, not text, should also have any revisions.
The ISM has much more data, tables and analysis on their website. For more graphs, see St. Louis Federal Reserve Fred database and graphing system.
Recent comments