
The April 2012 ISM Manufacturing Survey increased +1.4 percentage points to 54.8% PMI, and indicates U.S. Manufacturing grew at a faster pace in April. Survey respondents are concerned about economic conditions in Europe and worry about the meager U.S. job growth. Food and Beverages report warm weather increased their sales and Computers & Electronics says sales are slowing. Most manufacturers report an increased demand for their wares.

New Orders jumped +3.7 percentage points, to 58.2% with 15 industries reporting an increase in new orders and no industries reporting a decline. This is the best news of this month's report.
A New Orders Index above 52.1%, over time, is generally consistent with an increase in the Census Bureau's real series on manufacturing orders.

PMI is a composite index on manufacturing. Here's how the ISM defines PMI:
The PMI is a composite index based on the seasonally adjusted diffusion indexes for five of the indicators with equal weights: New Orders, Production, Employment, Supplier Deliveries and Inventories.
Below is the ISM table data, reprinted, for a quick view.
| Manufacturing at a Glance April 2012 | ||||||
|---|---|---|---|---|---|---|
| Index | April | March | % Point Chg. | Direction | Rate | Trend |
| PMI | 54.8 | 53.4 | +1.4 | Growing | Faster | 33 |
| New Orders | 58.2 | 54.5 | +3.7 | Growing | Faster | 36 |
| Production | 61.0 | 58.3 | +2.7 | Growing | Faster | 35 |
| Employment | 57.3 | 56.1 | +1.2 | Growing | Faster | 31 |
| Supplier Deliveries | 49.2 | 48.0 | +1.2 | Faster | Slower | 3 |
| Inventories | 48.5 | 50.0 | -1.5 | Contracting | From Unchanged | 1 |
| Customers' Inventories | 45.5 | 44.5 | +1.0 | Too Low | Faster | 5 |
| Prices | 61.0 | 61.0 | 0.0 | Increasing | Same | 4 |
| Backlog of Orders | 49.5 | 52.5 | -3.0 | Contracting | From Growing | 1 |
| Exports | 59.0 | 54.0 | +5.0 | Growing | Faster | 6 |
| Imports | 53.5 | 53.5 | 0.0 | Growing | Same | 5 |
| OVERALL ECONOMY | Growing | Faster | 35 | |||
| Manufacturing Sector | Growing | Faster | 33 | |||
Production, which is the current we're makin' stuff now meter, popped up +2.7 percentage points from last month to 61%. Production loosely correlates to the Federal Reserve's industrial production, where the April statistics will be out mid-month.

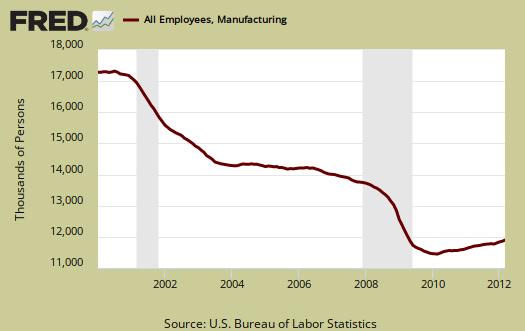
Now we come to employment, otherwise known as where are the damn jobs? The manufacturing ISM employment index increased +1.2 percentage points to 57.3%. The neutral point for hiring vs. firing is 50.1%. Only 13 industries reported an increase in hiring. Three showed a decrease in employment, Computer & Electronic Products; Petroleum & Coal Products; and Printing & Related Support Activities. Considering gas prices it's shocking to see a decline in employment in Petroleum & Coal. Computers & Electronics we already know is continually offshore outsourced.
Below are the BLS manufacturing non-farm payrolls (jobs) for the past decade on the left, in red (April's numbers are out May 5th), graphed against the ISM manufacturing employment index on the right, in blue. The BLS number is simply raw manufacturing jobs tally, from the CES, not taking into account population growth or overall sector shrinkage as well as time lag. One can eyeball a slight correlation in the middle of the decade, yet note the divergence this recovery, starting late 2008.
Inventories slightly declined -1.5 percentage points to 48.5%. Inventories are contracting. The ISM claims inventories are correlated to manufacturing inputs, that are part of GDP. Changes in inventories have made up a large part of GDP over the last two quarters.
An Inventories Index greater than 42.7 percent, over time, is generally consistent with expansion in the Bureau of Economic Analysis' (BEA) figures on overall manufacturing inventories (in chained 2000 dollars).
Durable goods March inventories were still at an all time high.

Supplier deliveries are how fast manufacturers can get their supplies. A value higher than 50 indicates slower delivery times, a value below 50 means the supply chain is speeding up. The index increased +1.2 percentage points to 49.2% and the ISM reports this it the 3rd month supplier deliveries have speed up, although this index is closer to the slow inflection point.

Backlog of orders dropped -3.0 percentage points to 49.5% and changed to contraction.

Imports had no change from last month and is at 53.5%. Imports are materials from other countries manufacturers use to make their products.

New orders destined for export, or for customers outside of the United States, popped up +5.0 percentage points to 59.0%, literally reversing last month's plunge. From the report, notice, no surprise, Electrical equipment is down.
The 12 industries reporting growth in new export orders in April — listed in order — are: Textile Mills; Furniture & Related Products; Apparel, Leather & Allied Products; Primary Metals; Chemical Products; Paper Products; Transportation Equipment; Food, Beverage & Tobacco Products; Machinery; Miscellaneous Manufacturing; Fabricated Metal Products; and Computer & Electronic Products. The two industries reporting a decrease in new export orders during April are: Nonmetallic Mineral Products; and Electrical Equipment, Appliances & Components.

Prices had no change and stayed at 61.0%. Prices are what manufacturers pay to make their products.

Customer's inventories increased +1.0 percentage points to 44.5%. Below 50 means customer's inventories are considered by manufacturers to be too low. Customer inventories, not to be confused with manufacturer's inventories, is how much customers have on hand, or rates the level of inventories the organization's customers have.

Here is the ISM growth and contraction sector ordered list:
Of the 18 manufacturing industries, 16 are reporting growth in April, in the following order: Furniture & Related Products; Printing & Related Support Activities; Machinery; Nonmetallic Mineral Products; Miscellaneous Manufacturing; Primary Metals; Paper Products; Transportation Equipment; Electrical Equipment, Appliances & Components; Plastics & Rubber Products; Apparel, Leather & Allied Products; Food, Beverage & Tobacco Products; Chemical Products; Fabricated Metal Products; Computer & Electronic Products; and Petroleum & Coal Products. The only industry reporting contraction in April is Wood Products.
The ISM has a correlation formula to annualized real GDP, but they are now noting the past correlation. Notice also that the PMI went to equal weighting in 2008. Annualizing April's data, the ISM get a 4.1% 2012 annual real GDP. The below graph plots real GDP, left scale, against PMI, right scale. One needs to look at the pattern of the two lines to get anything out of this graph. If they match, GDP goes up, PMI goes up, would imply some correlation. Why bother to even print this when real GDP comes in at 3% and below time and time again? Really ISM?
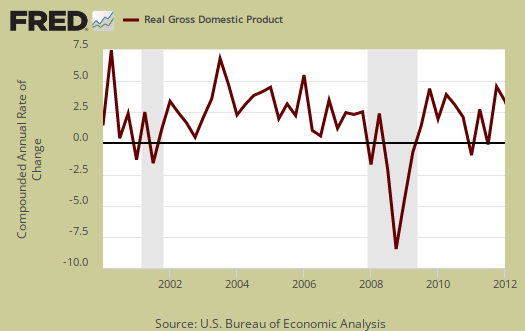
The past relationship between the PMI and the overall economy indicates that the average PMI for January through April (53.7 percent) corresponds to a 3.8 percent increase in real gross domestic product (GDP). In addition, if the PMI for April (54.8 percent) is annualized, it corresponds to a 4.1 percent increase in real GDP annually
The ISM neutral point is 50, generally. Above is growth, below is contraction, There is some some variance in the individual indexes and their actual inflection points. For example, A PMI above 42, over time, also indicates growth.
Here is last month's manufacturing ISM overview, unrevised.
The ISM has much more data, tables and analysis on their website. For more graphs, see St. Louis Federal Reserve Fred database and graphing system.
Oh yeah, PMI stands for purchasing manager's index.
Recent comments