
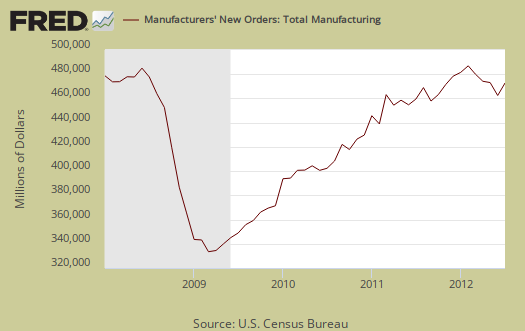
The Manufacturers' Shipments, Inventories, and Orders report shows factory new orders increased 2.8% for July. This is quite a turn around and new orders have increased two of the last three months, although May and June together were a wash, with +0.5% and -0.5% monthly changes in new orders respectively. This Census statistical release is called Factory Orders by the press and covers both durable and non-durable manufacturing orders, shipments and inventories.
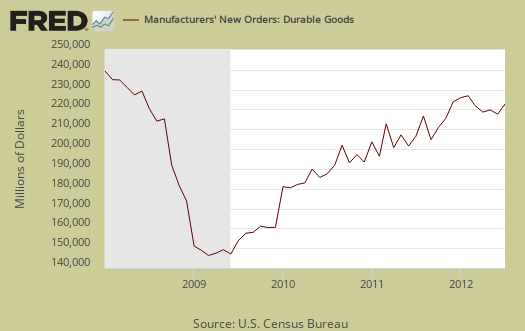
Manufactured durable goods new orders, increased +4.1% for July and June durable goods showed a +1.6% increase. Transportation equipment had another incredible blow out, with a +14.4% increase for July. Nondurable goods new orders increased 1.5%.
The durable goods new orders increase was due to transportation. Computers & electronics new orders declined -0.2%. Machinery dropped -4.1%, but primary metals increased 2.9%. Within the machinery category, new orders declined -32.2% for oil, gas and mining tools.
Within transportation equipment non-defense aircraft increased 53.9%. Motor vehicle body & parts new orders came alive again with a +20.6% increase. New orders for all manufacturing, minus just transportation showed much less of a splash, a +0.7% increase for July.
When we look at core capital goods it's not good news. New orders decreased -4.0% for the month. June also showed a decline in core capital goods new orders of -2.7%. Core capital goods are capital or business investment goods and excludes defense and aircraft.

Graphed below are the revised durable goods news orders. Notice that Durable goods new orders are just hitting the same level as early 2008.
Shipments overall increased +2.0% with June's shipments showing a -1.2% decline. Below is a graph of core capital goods shipments, which declined -0.5% as would be expected by last month's new orders drop.

Inventories for manufacturing overall increased +0.5%. Core capital goods inventories increased 1.1%. Inventories of manufactured durable goods increased +0.7%. Transportation equipment inventories are up 1.2% while nondurable goods inventories increased by +0.2%. Petroleum and coal inventories, which are part of nondurable goods, jumped by +1.1%. This report is by price, not adjusted for inflation.
The inventory to shipments ratio is 1.27, whereas June's ratio was 1.29. This implies a decrease of inventories to completed sales.

Unfilled Orders increased +0.8% overall with durable goods also having a +0.8% increase in unfilled orders. The statistic which stood out was computers, which had a -10.1% drop in unfilled orders.
Part of this report goes into GDP. The BEA takes this report, called M3, and uses the shipments values to calculate investment in private equipment, investment in software. Manufacturing inventories also goes into the changes in private inventories GDP calculation. At the bottom of this post is a little more information to estimate part of the GDP investment component.
The St. Louis Federal Reserve FRED graphing system has added individual NAICS data series from this report. If you're looking for a graph of some particular NAICS category, such as light trucks, autos & parts, or machinery, it might be found on FRED. Most news outlets source the Commerce Department, while technically correct, also makes it impossible for you, our beloved detailed reader, to find the actual statistical report and data. We like to link directly to the statistical release and cite who actually is issuing those statistics.
Here is last month's overview on factory orders, unrevised.
Recent comments