This week saw the release of both of the major national reports that track the condition of US home mortgages, coincidentally as of the last day of June, giving us an opportunity to compare them side by side, which should give us a better picture of the overall situation. We should note they're not directly comparable, however, because the Mortgage Bankers Association’s (MBA) 2nd quarter National Delinquency Survey is issued quarterly and is seasonally adjusted, whereas the June Mortgage Monitor (pdf) from Lender Processing Services (LPS) is a report issued monthly that is not seasonally adjusted. On previous occasions where their release has coincided, we've noted that the MBA has tended to show slightly higher delinquency rates than LPS; that's also true this time, though it's interesting to note that this end quarter they're converging, as the MBA report has mortgage delinquencies down slightly, whereas LPS shows a substantial jump in late house payments in June, turning their 3 month delinquency figures negative. The MBA also notes that the improvement they show in seriously delinquent mortgage percentages may be slightly less than they indicate because "at least one large specialty servicer that has received a number of loan transfers did not participate in the MBA survey"
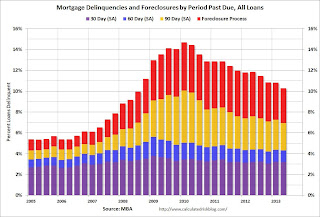 According to the MBA, the national delinquency rate, or the percentage of homeowners who were late at least one house payment late but not in foreclosure, declined to a seasonally adjusted 6.96% of all loans outstanding at the end of the second quarter of 2013, down from 7.25% at the end of the first quarter, and down from a delinquency rate of 7.58% a year ago, and the lowest level since mid-2008.. The percentage of mortgages that were in the foreclosure process, or those who've had foreclosure proceedings initiated against them but have not yet had their home seized, also fell over the quarter to 3.33% of all mortgages, from 3.55% at the end of the first quarter, and down from the foreclosure inventory rate of 4.27% one year ago. New foreclosures were started on just 0.64% of mortgages in the 2nd quarter, down from 0.70% in the first quarter and from 1.42% of all properties at the September 2009 foreclosure peak. The seasonally adjusted "serious delinquency rate", which includes those who more than 90 days delinquent in addition to those in the foreclosure process, was at 5.88% at the end of the quarter, down from 6.39% at the the end of the first quarter and a decrease from the 7.31% serious delinquency rate of a year ago.. Combined with those who have missed at least one mortgage payment, the total of all delinquent or in foreclosure mortgages at the end of march amounted to 10.29% of all mortgages on an seasonally adjusted bases, and 10.13% on an unadjusted basis, so despite the continual improvement in the overall delinquency rate, there were still more than one in ten homeowners who were behind on housepayments at the end of June...
The above bar graph from Bill McBride at Calculated Risk gives us a picture of what the relative size of each of the so-called delinquency “buckets” from the MBA survey have looked like over time. Each bar represents the percentage of homes delinquent or in foreclosure at the end of each quarter since the beginning of 2005, with the percentage more than 30 but less than 60 days behind on their housepayments color coded purple, the percentage more than 60 but less than 90 days delinquent in blue, the percentage that are seriously delinquent, ie, more than 90 days behind but not yet in foreclosure in yellow, and the percentage of those that are in the foreclosure process in red.. It’s clear that the total of all delinquent or in foreclosure homeowners is down considerably from the record 14.69% of all mortgages that the MBA survey showed in the first quarter of 2010, but still well above the 5.5% to 5.7% range of troubled mortgages common before the crisis..
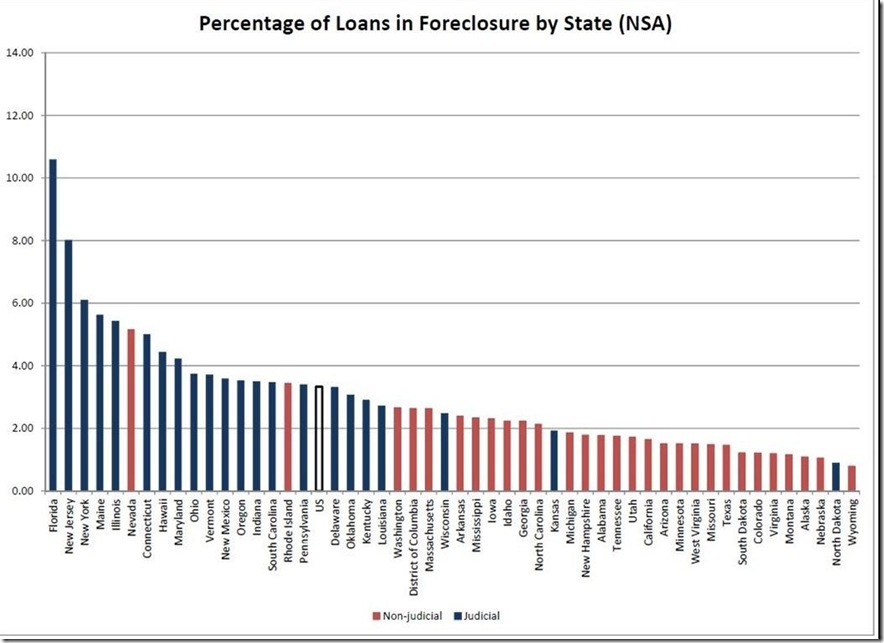
The next graph, from the MBA, shows the percentage of mortgages in the foreclosure process by state, with the states that have a judicial foreclosure process, where the bank must prove their right to foreclose on a homeowner in court, coded in dark navy, and those states with a non-judicial foreclosure process shown in red.. Obviously, the judicial process has slowed foreclosures down in those states that have it. The MBA gives the average foreclosure inventory in judicial states at 5.59% of all mortgages in those states, compared to a ratio of 1.86% of all mortgages for non-judicial states. Nevada, the only non-judicial state in the top dozen with the highest foreclosure inventories, passed a law in 2011 making it a felony if a mortgage servicer made fraudulent representations concerning a title, and imposed fines up to $5,000 for falsifying documents, which slowed foreclosures in that state to a near standstill. The states showing the largest foreclosure inventories are Florida at 10.58%, down from 11.43% in the first quarter, New Jersey at 8.01%, down from 9.00% in the last report, New York at 6.09%, down from 6.18%, and Maine at 5.62% down from 5.80%.. Meanwhile other states that have experienced significant foreclosures, such as California, with a foreclosure inventory rate of 1.64%, and Arizona at 1.51%, have a much smaller backlog because without the judicial process the banks can proceed on homeowners with impunity..
In contrast to the MBA survey, which showed delinquencies down to 6.96%, the June Mortgage Monitor (pdf) from Lender Processing Services (LPS) showed that new mortgage delinquencies spiked up 18.3% in June, after declining 5 months in row, raising their national mortgage delinquency rate to 6.68% from the mortgage crisis low of 6.08% in May.. Data from LPS showed that the nearly 10% jump in the national delinquency rate in June was largely the result of approximately 700,000 homeowners who were current on their mortgages in May falling behind by one payment in June. The deterioration in mortgages delinquencies was widespread, as the newly delinquent rate rose by more than 10% in all 50 states and did not seem to be the result of higher interest rates, as the delinquency rate for those with 30 year fixed rate mortgages increased at a slightly quicker pace than that for those with adjustable rate mortgages...
Of 49,823,992 active mortgages in June, LPS reported that 4,785,000 home loans, or 9.61% of all first lien mortgages, were at least one payment delinquent or in foreclosure at the end of June; of those, 1,983,000 homes loans were at least 30 days but less than 90 days late; another 1,344,818 mortgages were 90 or more days delinquent, but not yet in foreclosure, and 1,458,000 properties, were in the foreclosure process, ie, they had received at least one notice but their home had not yet been seized.. That foreclosure inventory was down from 1,335,000 in May, and at 2.93% of all mortgages, represents the first time homes in foreclosure fell below 3% of tracked properties since early 2009. There were 109, 042 foreclosure starts in June, the lowest monthly number of new foreclosures in a month since the crisis began..
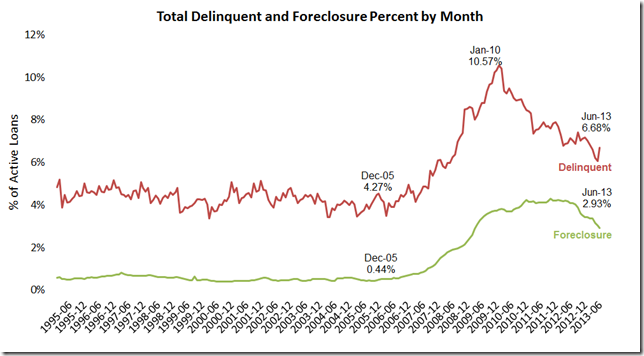 As most of the mortgage monitor is a graphic presentation, we'll have to look at some of those to see the rest of the story.. Our first graph is from page 4 of the mortgage monitor pdf and tracks with a green line the percentage of active home loans that have been in the foreclosure process, also known as the foreclosure inventory, from 1995 to the present. These are the home loans in between the time the servicer's attorney first initiates the foreclosure and the "foreclosure sale", which typically transfers title to the bank (terminology is on page 25 and 26 of the pdf). At 2.93% of home mortgages outstanding, we can see that's down considerably from the October 2011 peak of 4.29%, but still nearly six times the 0.44% foreclosure inventory of pre-crisis December 2005. Then in red, this graph tracks the percentage of loans that have been delinquent monthly over the same period, where we can see this June’s spike to 6.68% delinquent, following the largest year to date decline in delinquencies since 2002. We can also see the seasonality of delinquencies, where they usually peak at year end, when most people get overextended during the holidays, and then decline over the first few months of each year as homeowners catch up. Even at 6.68%, June's delinquency rate is still below the 7.17% rate of December 2012, when many homeowners put holiday shopping ahead of their housepayments, and still well below the peak percentage of 10.57% registered in January 2010, although it remains roughly 50% over the pre-crisis level, marked on the chart at 4.27% in December 2005...
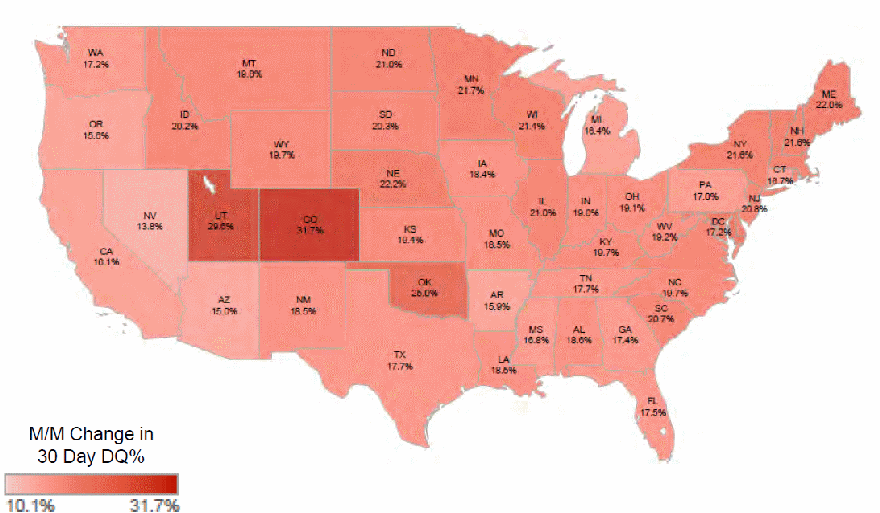
The map below, from page 5, shows the percentage of new delinquencies by state; ie, those who were current on their mortgage in May but fell behind in June. Unfortunately, the percentages even on the original map are difficult to read, but what the map shows is that all 50 states chalked up a new delinquency rate well over 10%, ranging from a low of 13.9% new mortgage delinquencies in Nevada to as high as 31.7% new delinquencies in Colorado and a 29.6% jump of those newly behind on their housepayments in Utah. The darker the pink, the greater the percentage of new 30 day delinquencies. Note that every state except Connecticut in the Northeast saw an increase of more than 20% in new mortgage delinquencies, as did Wisconsin, Illinois, Minnesota, North & South Dakota, Nebraska, Oklahoma, Idaho, New Jersey and South Carolina.
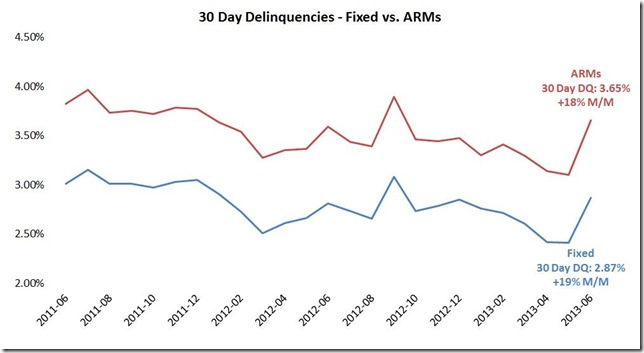
Next, the adjacent chart, from page 6 of the mortgage monitor, serves to show that the increase in delinquencies in June was not interest rate driven, because the increase in delinquencies for those with 30 year fixed rate mortgages, shown in blue, at 19% month over month, was greater than the 18% month over month increase for those with adjustable rate mortgages, shown in red. But also note on this chart that ARMs have been consistently more delinquent than the 30 year mortgages, and new delinquencies in ARMs at 3.65% in June outpaced new delinquencies in 30 day mortgages at 2.87%….
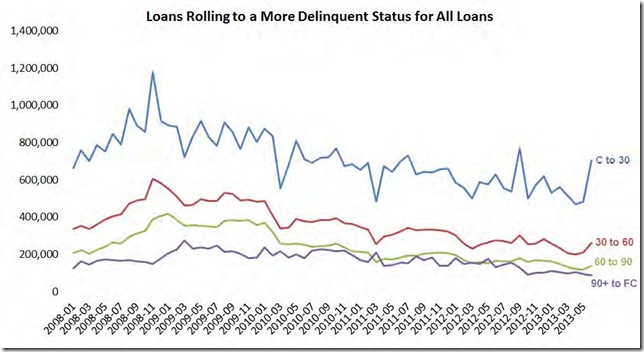
Then in our next graph below, from p 7 of the mortgage monitor, we'll see that it was not just new delinquencies, but every delinquency bucket that increased in June. This graph tracks the month over month change in quantity of mortgages of each delinquency range from the beginning of 2008 to the present. In blue we see the number of mortgages in each month that were current in the previous month that fell behind in that month; as LPS pointed out, there were over 700,000 new delinquent mortgages in June, which you see in the spike at the end of the graph; we'll note that the 30 day delinquency bucket increased from 1,243,194 in May to 1,471,134 in June, so that means over 450,000 other mortgagees who were 30 days late in May either caught up or fell further behind in June.. In red, we have the number of those mortgages that went from over 30 days in arrears to over 60 days late. The number of those between 60 and 90 days delinquent went from 465,129 in May to 511,731 in June. And in green in the chart below we have shown the homeowners who went from over 60 days delinquent to over 90 days behind each month; in June, those seriously delinquent mortgages increased to 1,344,818 from 1,334,660 in May. Finally, in purple below, we see the percentage that were seriously delinquent that had foreclosure proceedings initiated against them was down in June, and as we noted earlier, the 109,042 foreclosures initiated in June was the lowest monthly new foreclosures since before 2008...
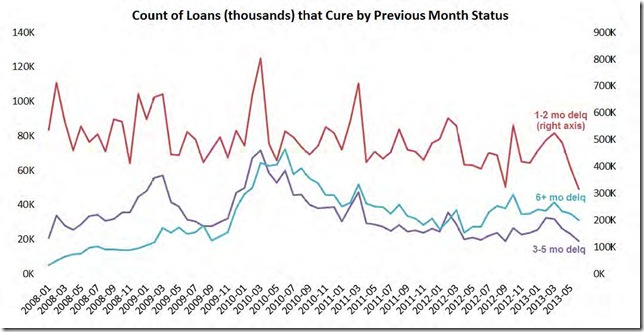
The next graph, from page 8, shows that the deterioration in homeowner's mortgage payment situations in June also affected the number of delinquent mortgages that "cured", or those who were delinquent who got caught up during each month. In red, we have graphed the number homeowners who were one to two months behind on payments who caught up on their payments each month, which collapsed to a five year low in June. Although LPS doesn't provide the data, it also appears the same is true for those who were 3 to 5 months behind, as the violet line on that graph representing that cure bracket also seems to be at a 5 year low. Meanwhile, the number of those who were more than 6 months delinquent who got caught up in June, as indicated by the teal blue graph, also appears to be at it's lowest level since early 2012. Note the number of cures for these last two is on the left scale, while it's on the right for the short term delinquencies...
Despite this obvious deterioration in June mortgages, LPS Applied Analytics Senior Vice President Herb Blecher tried to spin it into a seasonal phenomena in the press release accompanying the release of the mortgage monitor, noting that payment situations deteriorated in June in all but 4 of the past 18 years. This may be true, but looking back over the record, we dont see a single month in the past two years that saw this large an increase in 30 day delinquencies; as we noted, the 30 day bucket saw an increase of 227,940 mortgages in June (from 1,243,194 to 1,471,134); last June's increase was from 1,390,010 to 1,464,660, only one third that of this June's at 74,960, and the delinquency rate increase in June 2011 was just 2.4%. Even the infamous September spike in mortgage delinquencies accompanying the release of the iphone 5 was smaller at 219,998 new delinquencies.. We did see June spending outpaced incomes by a bit last week, yet there is nothing else obvious in June data that we've seen to date that could have precipitated this apparent shortfall of homeowner budgets that would cause such a widespread and precipitous increase in new delinquencies.
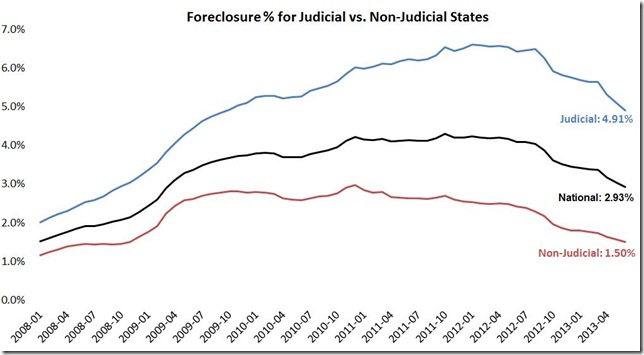
We also want to take a look at some LPS graphics regarding the foreclosure inventory in judicial and non-judicial states, to compare to similar data we saw from the MBA. This next graph, to the right, from page 16 of the mortgage monitor, shows the foreclosure inventory as a percentage of all mortgages since the beginning of 2008.. You'll recall these are those homes that are stuck in the foreclosure process but have not yet been seized.. The blue track on the graph shows the percentage of homes in judicial states that are in the foreclosure pipeline, now down to 4.91%, after having peaked at 6.60% in January of 2012. The red line tracks the percentage of home mortgages in non-judicial states that were in the foreclosure process; this is now down to 1.50%, after having peaked at 2.97% in December of 2010. The black line is simply the national average, now at 2.93%..
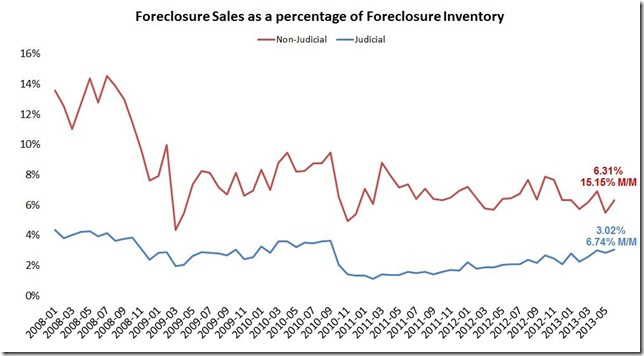
Meanwhile, the graph below, from page 15 of the mortgage monitor, shows the percentage of this foreclosure inventory that has proceeded to the next step each month, which is euphemistically referred to a a foreclosure sale, where the home is usually auctioned back to the bank in lieu of the unpaid mortgage debt and becomes part of their REO inventory (Real Estate Owned -- terminology is on page 25 of the pdf).. As the red track representing non-judicial states shows, without court intervention this has historically proceeded quite rapidly, from home seizure rates above 12% of all foreclosure inventory early on in the crisis to the recent rate of 6.31% in June, which was up 15.16% from May's rate.. The blue line shows the percentage of homes in judicial states that are in foreclosure which have been seized each month; you can see it dropped well below 2% when foreclosure fraud was in the news a few years back, but it's now crept back up to over 3% at 3.02% of all foreclosed homes as of June, 6.74% more than May's rate...
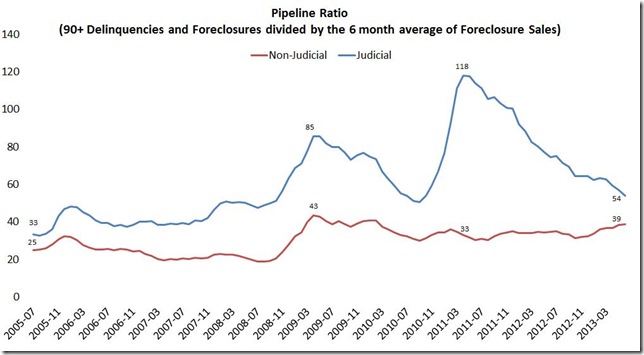
The next graph, from page 17 of the pdf, shows that the pipeline ratios, or the average number of months it typically takes for a foreclosure to be completed, have been converging for judicial and non-judicial states. In this computation, which you see on the chart, LPS takes the total number of seriously delinquent and the in foreclosure process mortgages and divides it by the average number of completed foreclosures per month in each state over the previous six months to come up with the number of months of foreclosure backlog there is for that state (assuming all seriously delinquent mortgages proceed to that final stage) With the slow pace of completed foreclosures nationwide, that pipeline has stretched out to well over 3 years nationwide; 54 months for judicial states and 39 months for non-judicial states. Note that the mean foreclosure pipeline time was as high as 118 months – nearly 10 years - for judicial states during the foreclosure moratoriums imposed by the banks during the wake of the robosigning scandal. The national average number of days that a foreclosed property has remained in the foreclosure inventory is now up to 860 days as of this report, while the average seriously delinquent mortgage has remained seriously delinquent for 512 days without proceeding to foreclosure…
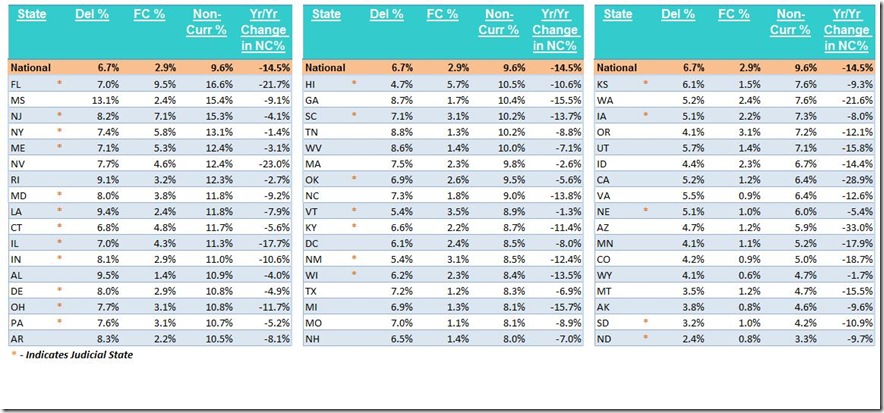
Finally, the next two graphics will break this all down by state.. First, from page 22 of the pdf, we have the table of non-current mortgage and foreclosure percentages in all 50 states and the District of Columbia which we’ve featured in previous months. The first column shows the delinquency rate for each state, ie, the percentage of mortgages in each state that are at least one month behind and not yet in foreclosure, a category that’s jumped for each state this month.. The second column is the percentage in each state that are in foreclosure, which has been falling consistently, by at least a point or more every month over the past year, and the third column is the total non-current percentage, or sum of all those behind of their mortgage, which rose from 9.13% nationally in May to 9.61 in June. Note that the last column, which shows the year over year percentage change in non current mortgages in each state, is still falling for every state despite June's jump, although some states, like New York, Vermont and Wyoming, have barely seen any change in a year...
Also note that judicial states, where banks must establish their right to foreclose in court, are marked on the table below by a red asterisk. These states have the highest percentages of mortgages still stranded in foreclosure, led by Florida, where LPS shows 9.5% of all mortgaged homes still in foreclosure, contrasted to the 10.6% in foreclosure the MBA showed. Other judicial states with a foreclosure inventory greater than 5% include New Jersey at 7.1%, New York at 5.8%, Hawaii at 5.7%, and Maine at 5.3%...non-judicial Mississippi has remained an outlier here years, with a low foreclosure rate despite the fact that 15.4% of their homeowners still remain non-current on their mortgages...
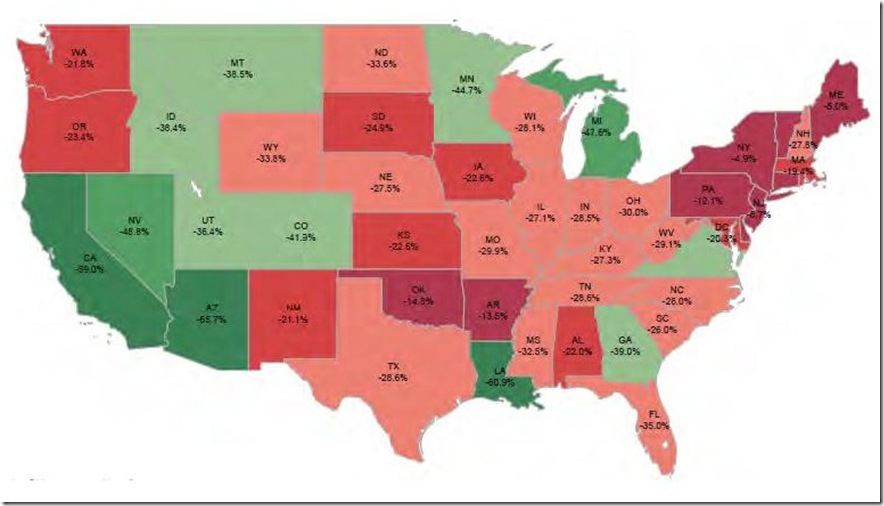
Lastly, the map graphic below, from page 18 of the pdf, shows the percentage improvement in "performance" of non-current mortgages that each state has made from worst of the mortgage crisis for each state.. Note that the scale runs from just 4.9% off the peak for the deep red state of New York, to a 65.7% "improvement" in dark green Arizona, where most seriously delinquent homeowners were quickly foreclosed on. You'll note that the non-current inventory remains near the delinquency peak in most of the Northeast, with only 5% more mortgages in Maine current now than at the worst of the crisis, and just an 8.7% improvement from the worst in New Jersey...

Comments
Maryland, just ballooned
in a "foreclosure cluster", how interesting, as in timing is everything and shadow inventory.