
The latest NAR headline buzz blares the highest pending home sales since April 2010, the housing bust is over and the market is recovering.
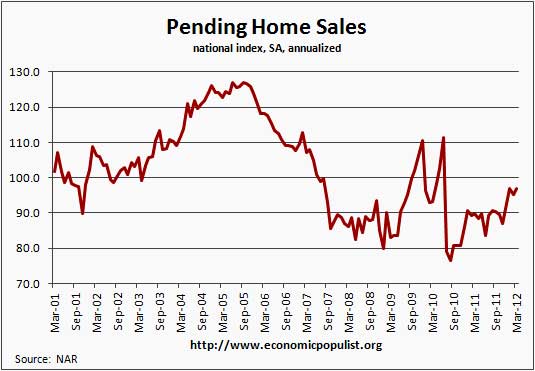
The NAR Pending Home Sales Index is based on contract signings and indicates actual sales a couple of months later. Pending Home sales are not actual closings. For March the index increased 4.1% from February and has increased 12.8% from a year ago. The actual March index value is 101.4. April 2010's index value was 111.3.
As we can see from the above historical graph, pending home sales have been higher, right in the middle of the housing bust, mainly due to the first time home buyer's tax credit. Additionally March 2012 is still much lower than April 2010 and finally, pending home sales are somewhat statistically noisy, or not a smooth progression month to month.
Contracts maybe signed but as of late, many do not make it to final sale. From the existing home sales report, we have NAR now refusing to publish the percentage of contracts cancelled, claiming often another contract is offered after a cancellation. In other words, we don't know how many of these pending sales will actually go through. In January 2012 one third of contracts were cancelled.
This index is based on 20% of existing home sales. It helps to also know what the pending home sales index is normalized to, 2001. Think about the U.S. population growth since 2001.
An index of 100 is equal to the average level of contract activity during 2001, which was the first year to be examined as well as the first of five consecutive record years for existing-home sales; it coincides with a level that is historically healthy.
We've seen this headline buzz before, pending home sales jump to a 2 year high. This financial press headline hype was for July 2009 PHSI. The actual 2009 data had everything to do with the temporary first time home buyer's tax credit versus a sustained residential real estate market recovery. It looks probable the worst is over for residential real estate but having a dramatic uptick in activity, just simply isn't appearing in other indicators.
The PHSI are contracts which have not yet closed and why it is considered a future housing indicator. From the NAR:
NAR's Pending Home Sales Index (PHSI) is released during the first week of each month. It is designed to be a leading indicator of housing activity.
The index measures housing contract activity. It is based on signed real estate contracts for existing single-family homes, condos and co-ops. A signed contract is not counted as a sale until the transaction closes. Modeling for the PHSI looks at the monthly relationship between existing-home sale contracts and transaction closings over the last four years.
We just saw Case-Shiller crash and burn for home prices. The Census New Homes index also dropped.
No surprise NAR is calling a home price bottom, as are others. The problem is we've been here before. Compare the below Zillow 2013 prediction graph to Case-Shiller (graphs at link) and in particular, Atlanta. Which one do you believe?
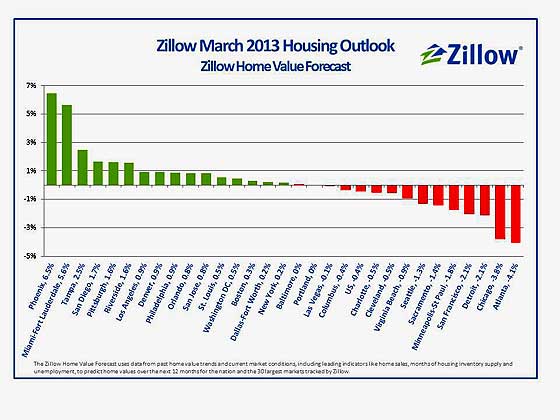
Bottom line we've been here before and home prices are simply still out of alignment with median wages. One cannot afford a home while making less than $26k a year. Additionally, calling a home price bottom does not mean a return to bubble level valuations. Negative equity is here to stay.
Below is the regional breakdown for NAR March pending home sales:
The PHSI in the Northeast slipped 0.8 percent to 78.2 in March but is 21.1 percent above March 2011. In the Midwest the index declined 0.9 percent to 93.3 but is 16.9 percent higher than a year ago. Pending home sales in the South rose 5.9 percent to an index of 114.1 in March and are 10.6 percent above March 2011. In the West the index increased 8.7 percent in March to 108.0 and is 9.0 percent above a year ago.
home builder reports
Calculated Risk has tabulated the major new home builder's orders and sales data for Q1 2012. Click here to read it. CR is much more bullish on a housing bottom, but this report does show some positive activity. I'm more of a naysayer for a few reasons, basically the middle class is wiped out and so many foreclosures still in the pipe.