
Barry Eichengreen and Kevin H. O’Rourke have been updating us on the progress of this depression by comparing it to the big one, The Great Depression. Their original post, in April 6, 2009, captivated their audience.
One thing that struck me was that we might compare the two events to the totally overlooked depression of the 1970s – The Great Stagflation. The reason why this one is missing and, perhaps, lost from official economic history is that it did not look anything like how we expect a depression to look – at least by the accepted, albeit vague, standard of what constitutes a depression. For instance, as shown in the graph below, year over year Gross Domestic Product enjoyed an unbroken expansion during the entire period.
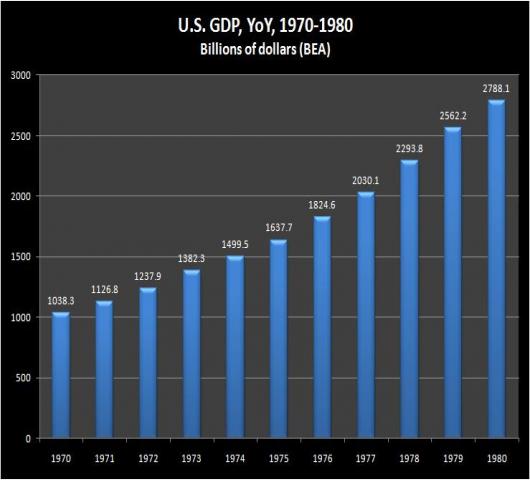
Chart 1 (Source: Bureau of Economic Analysis)
Compare this performance to the contraction of GDP during the Great Depression
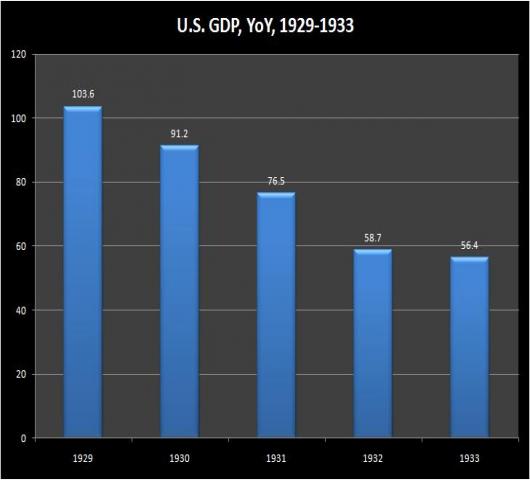
Chart 2 (Source: Bureau of Economic Analysis)
However, when The Great Stagflation is subjected to the critical observation of an ounce of gold, the contraction of the economy easily exceeds both the present contraction of economic activity in intensity, and its more infamous companion of the 1930s in both intensity and duration, as shown below.
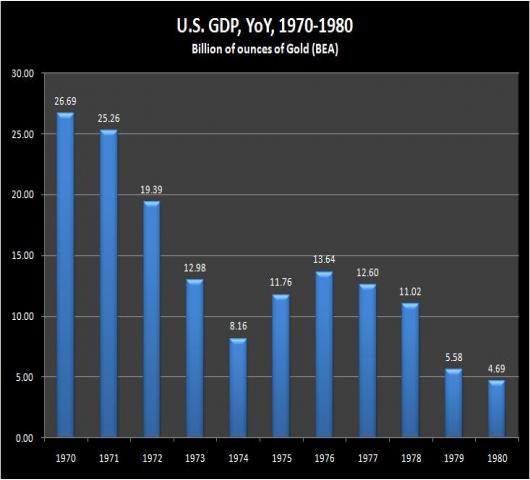
Chart 3 (Source: Bureau of Economic Analysis)
Moreover, in this snapshot of the decade we can see evidence of the 1973-1975 recession, which bottoms in 1974, yet shows no evidence of its existence on chart 1 above. It appears as a dead cat bounce – a momentary recovery before the final leg of the depression unfolds.
Be that as it may, the Great Stagflation presents a bit of a problem: Although gold tells us it occurred, Gross Domestic Product, as measured by dollars, actually ended higher than it began in the 1970s contraction. Peak unemployment, though higher also, was nowhere near the peak of the Great Depression. U.S. trade volume positively exploded, whereas it viciously contracted during the Great Depression. Here is a comparison between these two depressions, with the current Great Recession thrown in for good measure.
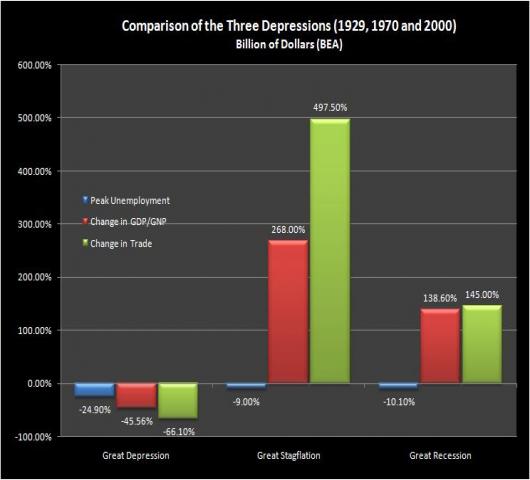
Chart 4 (Source: Bureau of Economic Analysis)
When we use the price of an ounce of gold to measure the progress of the current depression an altogether striking contrast emerges with the official portrait. Not only are we in a depression-like event, but that depression has been clearly evident since 2000.
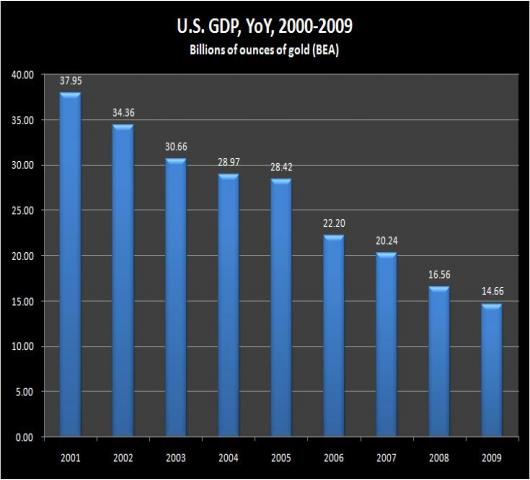
Chart 5 (Source: Bureau of Economic Analysis)
Again, between 2004 and 2005 we see evidence of some slight flattening in economic activity, as the housing bubble reaches its crescendo. The bounce, however, is nowhere near that of the 1973-1975 period.
The real similarity here is to the steady progressive decline of economic activity during the Great Depression as shown in chart 2 above. There are two possible explanations for why these three depressions appear so different: Either gold is wrong, and what happened in the 1970s wasn’t a depression. Or, gold is right and the accepted definition of a depression is wrong.
In the former case, what is happening now is not a depression. In the latter case, what is happening now is a depression at least approaching the duration of the 1970s and the intensity of the 1930s.
So, how do we break this analytic impasse?
The important thing to remember here is that until 1933 there was only one measure of GDP. As the Great Depression unfolded it was expressed in the single footprint of a dollar pegged to a definite amount of gold. When the economy crashed in terms of an ounce of gold, it also had to crash in "dollar" terms, since the dollar was backed by gold.
By 1971, the United States defaulted on the Bretton Woods agreement and no longer honored its commitment to settle its international obligations in gold. The dollar was allowed to float against gold, and thus emerged a discrepancy between two measures of economic activity. Gold continued to reflect the true value of economic activity through the inverse action of its dollar price. Whenever economic activity contracts, the dollar price of gold rises. During expansions the dollar price of gold falls.
It follows from this that gold can be telling us that we are in a depression, even though the dollar measure of the economy shows no evidence of this depression. Using the dollar to measure whether we are in a depression or not is, therefore, is not only useless, it is absolutely misleading to anyone trying to understand what is taking place in our economy.
Comments
Hi Jehu, interesting
The site is truly missing the great stagflation and frankly I think we should be looking at 2001, the great job exodus to China, because I suspect this has a large "structural" (i.e. we shipped your job to China and India) component than realized.
but I don't quite get at all the Gold connection. I'm not a gold bug so maybe that's me.
Nice graphs but what is the unit for GDP during the Great depression period?
The connection between gold and the economy
Robert,
I am not a "gold bug" either. Gold is an analytical tool for me, not a speculative metal.
In each case I am measuring GDP in ounces of gold. In the opening years of the Great Depression, gold was fixed at 20.67 per ounce. In 1933, the dollar was devalued to $35 per ounce. The contraction phase of the Great Depression ends in that year. Between 1971 and 1980, the contraction phase of the Great Stagflation, the price of gold was no longer fixed - it was allowed to float.
So think of it this way: when you look at the contraction of GDP during the Great Depression you are actually looking at the what is happening in terms of an ounce of gold - not dollars. But, when you look at what happened during the Great Stagflation you are looking at dollars that are no longer fixed to an ounce of gold.
What I am proposing is if you want to understand the Great Stagflation and the Great Recession you should continue to keep your eye on what is happening to the economy in terms of an ounce of gold. Economic indicators measured in dollars are a misdirection.
I have more data to discuss on this subject.
Nixon Shock
Nixon took the U.S. off of the Gold Standard in 1971 and ushered in the era of derivatives as a side effect.
I don't know much more about international currency exchanges, during 1971, pre than that, so I guess I should read up?
admin FYI
Just a minor note and just something to think about for next time, this is more of a blog post than an Instapopulist. Not a big deal.
How do I move this to a blog?
"this is more of a blog post than an Instapopulist."
How do I move it? Let me know.
well
I can move it for you but it entails breaking the link. Most of our readers come through RSS feeds, and all posts go out through the RSS. How about just leave it for now and after we have the Instapopulist "full" with new posts and in the Instapopulists I put the EIs with the FRED charts I use, plus my snide comments sometimes and then for short posts like "SEC slaps GS's wrist" and so on.
Blog posts go into your own personal RSS feed, every registered member has their own blog on EP de facto, so if you want to link to just your own writing, you can just grab your own feed and link.
So, howz that? It's a "trick" I use that won't break the current link but also move it to your blog in a bit. Remind me if I forget, just a few days.
You also have your own upload space for charts and if you're really ambitious, the site does have a version of LaTeX for equations, described in the admin forum.
Thanks...
This is just the beginning of an idea I am developing on the subject - I think it might be fruitful to the discussion on a number of fronts...
Jehu, changed to blog from Instapopulist
Your friendly neighborhood admin changed this posts content type to blog. It should now pop up on your RSS feed. ;)
(Great formatting btw!)
Thanks Robert
EOM