
The cold week that we saw at the beginning of this month set quite a stunning record for US natural gas supplies, and put an exclamation point on our concerns about the natural gas that we're exporting. In the first week of the new year, or more specifically over the week that ended on January 5th, the demand for natural gas was so great that we had to use nearly eleven and a half percent of all the natural gas that was in storage in the US, in addition to everything that was produced by US wells during the week, to meet the needs of heating, industry, power generation, and contracted exports. As you know, on Thursday of every week (except on holidays), the EIA publishes the Weekly Natural Gas Storage Report, which reports on the amount of natural gas in storage in each of the 5 energy regions and in total as of the prior Friday. This week, that report showed that we had withdrawn a record 359 billion cubic feet of natural gas from storage during the week, an all time high by more than 25% over the previous record gas withdrawal. Since not many of you would follow a link to the report, we'll just include the lead table from that natural gas storage report here now, and explain what happened:

The above is a copy of the initial table from this week's Natural Gas Storage Report, covering the changes of natural gas in US storage for the week ending January 5th. The first column of numbers shows the amount of natural gas in billions of cubic feet that was left stored in each US region and naturally as of January 5th; the 2nd column shows the amount of natural gas in billions of cubic feet that had been stored as of a week earlier, ie, as of December 29th, and the 3rd column shows the change between the two. Then, in the columns on the right, we have similar totals of natural gas in storage during the same week a year ago, and the 5 year averages for this time of year. Thus, we see that the US started the week with 3,126 billion of cubic feet of natural gas in storage, and by the end of the week that had fallen to 2,767 billion of cubic feet, which means we used 11.5% of all the natural gas we had in the entire country in just one short week. With just 2,767 billion of cubic feet left at the end of the week, that quite simply means that if we continue using natural gas from storage at the same 359 billion cubic feet rate that we used it this week, we'll run out of it in 8 weeks, completely. There will be no natural gas left in the entire country. Period.
Next, we'll show you a chart of our natural gas supplies over time so you can see how this week's drop stands out.

The above graph also comes from this week's Natural Gas Storage Report, and it shows the quantity of natural gas in storage in the lower 48 states over the period from December 2015 up to the week ending January 5th 2018 as a blue line, the average of natural gas in storage over the 5 years preceding the same dates shown as a heavy grey line, while the grey shaded background represents the range of the amount of natural gas in storage for any given time of year for the 5 years prior to the two years shown by the graph. Thus the grey area also shows us the normal range of natural gas in storage as it fluctuates from season to season, with natural gas in storage underground normally building to a maximum by the end of September, falling through the winter, and usually bottoming out at the end of March, depending of course on the weather during any given year. We started the 2017-18 heating season with our supplies roughly 5% below normal, short of 3,800 billion cubic feet, and with this big drop in the first week of 2018, about half of our normal range of winter drawdown is already gone, and we are now tracking the 5-year minimum of gas supplies seen the polar vortex year of 2014, which is indicated by the bottom of the grey shading...
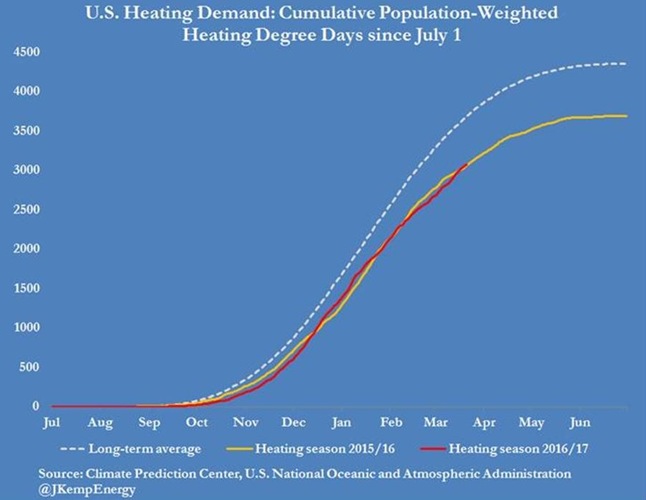
We can also see by the blue line above that the quantity gas we had stored throughout 2016 was at a record high for each week during the year, up until October, when US natural gas supplies topped 4 trillion cubic feet for the first time in history. Gas supplies then dropped from that record to nearly normal by the end of December, at which time we felt that shouldn't have happened in a warmer than normal winter. By March of this past year, based on John Kemp's data that showed heating demand was 17% below normal for the year, we warned that we were not covering our natural gas needs from production, even while winter temperatures were above normal, and that something would have to give if we ever saw a colder than normal winter...
To the best of my knowledge, the EIA does not publish weekly natural gas production figures, or how much gas comes out of US wells each week. They do publish monthly natural gas production figures, however, with a couple month lag for the time it takes them to compile accurate data. Looking at that data, we can see that over the first 10 months of 2017, US natural gas production totaled 22,113 billion cubic feet, or an average of 2,211.3 billion cubic feet per month. There are 304 days during the first ten months of the year, so that means our average daily natural gas production was 72.74 billion cubic feet during 2017. Multiplying that by 7 gives us a average weekly natural gas production of 509.18 billion cubic feet for the first ten months of the year. If that average held through to the first of the new year, that suggests that during the week ending January 5th, we used that 509 billion cubic feet of production, plus the 359 billion cubic feet of natural gas we took out of storage, for an approximate total of 868 billion cubic feet of natural gas consumption for the week ending January 5th. Put another way, by using 868 billion cubic feet during that week, we were using 70% more natural gas than what we were producing.
This week's record drawdown really got started on New Year's Day, when the US set a record for natural gas consumption. The EIA commemorated that record with a blog post, titled ‘Cold weather, higher exports result in record natural gas demand’, which included a couple graphics which we think will be useful in explaining what happened...

As we noted, the above graphic comes from the EIA post titled Cold weather, higher exports result in record natural gas demand, which explains the record natural gas usage in the US on New Year's day. On the left half of that graphic, the EIA presents a very tight graph showing US natural gas consumption daily from the beginning of 2013 to the end of 2017. Of course, one can't discern any daily amounts on such a small graph, but they highlight the previous record of 143.3 billion cubic feet of natural gas that were used on January 7th, 2014, which was topped by the 150.7 billion cubic feet of natural gas that were used on New Year's day of this year. Not coincidentally, that brown graph shows our natural gas exports in a darker shade across the bottom of the graphic...
On the right of that brown graph, the EIA presents a bar graph that highlights the differences in natural gas usage between the old single day record and the new one set on New Year's day. The blue part of each bar represents the portion of the day's natural gas consumption that was used for heating, and it's pretty obvious that heating use was greater on January 7th 2014 than on January 1st of this year. Next, the yellow part of each bar is that portion of each day's natural gas consumption that was used for power generation, and here the 2018 record clearly tops the power usage of old record in 2014. Industrial usage of natural gas, shown in green, may have also been greater on 1/1/18 than on 1/7/14, but not by much. "Other" usage of gas, shown in brown, was also quite close to the old record. But the big difference, shown in shaded of red at the top of the bars, was our natural gas exports, by pipeline to Mexico in cheery and as LNG in sangria by tanker to destinations world wide, that really put this week's record gas demand over the top.
From here, the shortfalls of natural gas supplies during winter will only get worse. For instance, earlier this year, the EIA projected that natural gas for power generation would increase by 8% in 2018. That would add nearly 3 billion cubic feet more to daily demand. But the real issue going forward is going to be increasing LNG exports, which, based on those liquefaction facilities already under construction, could easily triple by the end of next winter. Since much of the natural gas that the power plants and the LNG exporters will be using is already under contract at the near record low prices that natural gas has been quoted at over the past few years, it will be the residential and commercial users that will be paying the higher prices that the coming shortage of natural gas will inevitably precipitate.
note: the above was excerpted from my weekly synopsis at Focus on Fracking…
Comments
A cold-snap? Where was this?
A cold-snap? Where was this? Would you believe that between January 4th, 2018 and January 15th, 2018 that Metro-Denver averaged just under 16 F worth of anomaly on an average basis among more than 40 global trade competitors?