
The March 2010 monthly unemployment figures are out.
Nonfarm payroll employment increased by 162,000 in March, and the unemployment rate held at 9.7 percent.

Below is the nonfarm payroll, seasonally adjusted:
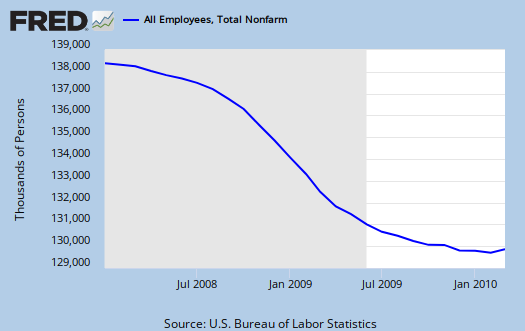
The first thing you probably want to know is how many of those jobs are Census workers? The report claims 48,000 of the above jobs are temporary Census workers.
- Long term unemployed - up 414, 000 to 6.5 million
- Forced Part Time - 9.1 million
- Marginally attached to the labor force - 2.3 million
Of the Marginally attached, 1 million are discouraged.

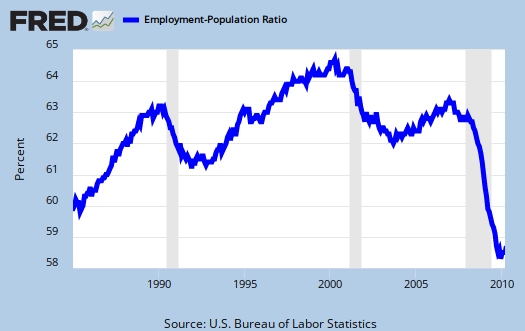
The civilian labor force participation rate increased, 64.9% as did the employment to population ratio, 58.6%.

U6, or Total unemployed, plus all persons marginally attached to the labor force, plus total employed part time for economic reasons, as a percent of the civilian labor force plus all persons marginally attached to the labor force, (table A.15), increased to 16.9%. That's not good.
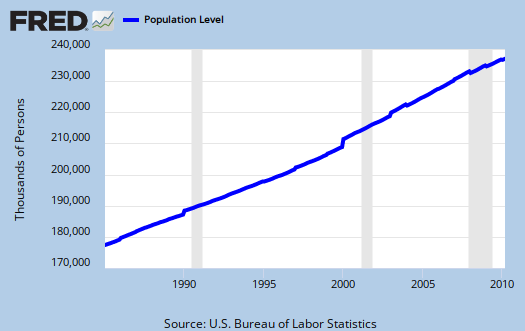
While the Census jobs were much less than expected, of the total number of jobs created, only 74,000 were permanent. There were 40,000 temporary jobs added in addition to the 48,000 Census workers. I'm sorry folks, that's not a V, for one needs at least 100,000 and some estimate up to 300,000 permanent full time jobs, added each month to keep pace with U.S. civilian workforce population growth. That's not general population, that's the group needing a job. Below is the graph of the civilian non-institutional population, which is the largest super-set of the potential labor force, larger than the civilian workforce, due to those who are not looking for work, retired and so on being counted in this figure.
In looking over table B1 we can get a little more detail on what kind of jobs were created (and lost) on the permanent jobs front.
- Financial: -21,000
- Information: -12,000
- Construction: +15,000
- Manufacturing: +17,000
- Mining & Logging: + 9,000
- Health and Education: +45,000
- Leasure and Hospitality: +22,000
- Professional & Business Services: +11,000
- Trade, Transportation, Utilities: +31,000
One needs to break these down further. For example, in trade, 14,900 of those jobs are retail. In Professional & Business Services we see massive temporary hires, 40,000, yet Professional & Technical (these are the engineering jobs included) are down -12,500. What has increased in the Professional services category is waste management, by 24,300. What's the good news? More manufacturing jobs and even more shocking, construction appears to be stabilized. What's the bad news? It appears from table B1 those high paying jobs, those which generate even more jobs, such as Science, Technology, Engineering, Mathematics, many of those jobs actually decreased.
There were also two revisions:
The change in total nonfarm payroll employment for January was revised from -26,000 to +14,000, and the change for February was revised from -36,000 to -14,000.
Subject Meta:
Forum Categories:
| Attachment | Size |
|---|---|
| 209.52 KB |
From the headlines
this is different. Thanks for going into the details because the news just reads the headline and doesn't tell the real story on temporary jobs.
WSJ interactive graphic, must see
The Wall Street Journal put together a flash graphic showing the growth of job losses per business/occupational sector that's just dynamite.
here is the link.
While one would expect construction to wither and die due to the collapse of both Residential and Commercial Real Estate, what is surprising is to watch manufacturing job losses be much greater than anything else. I hope to find out (beyond the 3 big autos imploding) why exactly those losses were so great when the real bubble was in residential and of course finance. But it's an amazing graphic where health care is one of the few growth sectors. What does that mean? Not everyone suddenly turned old an feeble in such a short time period.
(h/t Ritholtz who has grabbed graphs from others in a unemployment chart round up.