
The headlines blare unemployment rate lowest since March 2009! Yet November only added 120,000 jobs, barely enough, as usual, to keep up with population growth. So, how could the official unemployment rate drop -0.4 percentage points, from 9.0% to 8.6% in a month?
Let's look at the data.
First, the unemployment rate is a ratio. See what's the real unemployment rate and under the hood for more details.
This month the civilian non-institutional population increased +172,000 to 240,441,000. The civilian non-institutional population are those 16 years or older not locked up somewhere or not in the military or so sick and disabled they are in a nursing home and so on. Below is a graph of the monthly change in non-institutional population.

You see those yearly spikes and drops? Those are not magic sudden changes in population, those are statistical yearly adjustments. In other words the BLS adjusts the error for the entire year and tacks it onto the change between December and January. All other ratios, including the unemployment rate, are derived from the non-institutional civilian population base. The workforce comes from this group of the population.
Next is the civilian labor force. This is where the official employed and unemployed come from. This month the civilian labor force dropped -315,000 to 153,883,000.
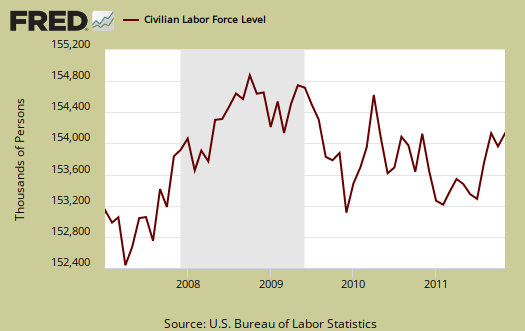
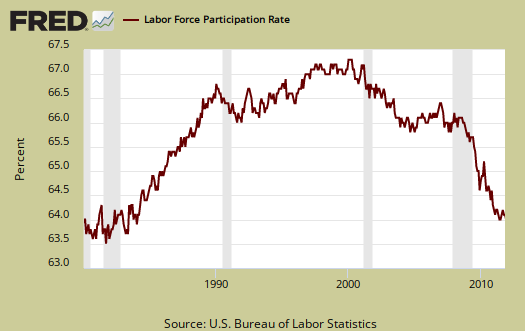
The ratio of those participating in the workforce is 64% to those who are not. In other words only 64% of the non-institutional civilian population is counted as the labor force. In other words, only 64% are considered participating in either working or officially looking for work. This ratio is at all time lows and dropped -0.2 percentage points in November.
The unemployment rate is calculated by:
There are two places the unemployed can go. They found a job or dropped out of the count and entered not in the labor force.
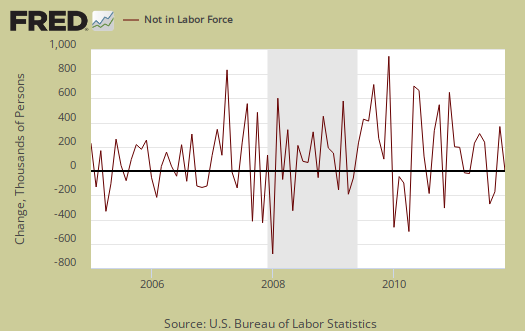
The monthly change for those not in the labor force who are part of the non-institutional civilian population increased +487,000. The monthly change of those not in the labor force is a statistically noisy figure, as shown in the below graph pf the monthly changes.
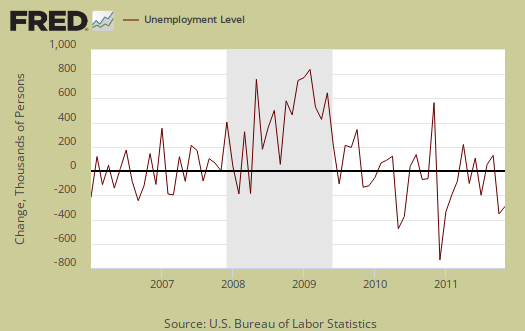
Those of the civilian labor force who are employed increased +278,000 to 140,580,000. Below is the monthly change in employment levels.

Yet those unemployed decreased -594,000 to 13,303,000.
Subtracting off those who got a job, i.e. are now employed, assuming all new employed were not first time job holders, we still have 316,000 people unaccounted for. Did they all start businesses? No, those people are already accounted for in the employed levels. But if one looks at the not in the labor force figure, that's where these previously unemployed went, they dropped off of the count.
This is why most look at payrolls data, a separate survey from businesses, on how many actual jobs were added. The household survey, from where the unemployment rate comes, has not incorporated the 2010 Census data yet, has a smaller sample size, a larger error margin, plus those yearly adjustments. All of these elements can give a warm, fuzzy feel good on a dropping unemployment rate, when actually there is not more new jobs available or enough to justify a 0.4 unemployment rate drop in a month. Don't let mass media headline buzz, psychology, illusion, mess with your head on the employment statistics. Realize it's all a ratio and there is a large segment of the working population that is classified as not in the labor force. Bottom line, we're still in a jobs crisis, no doubt about it.
Comments
NPR News coverage
Excellent background blog on how the numbers work, from the headlines down into the nitty-gritty of real life.
I think it's important to be able to refer people to this kind of investigative background reporting, because otherwise it's just another one of those 'you have your opinion and I have mine' things.
Bottom line, most people are well aware that we're still in a jobs crisis, but there are still some who like to parrot the 'party line' in defiance of the obvious. It's important to have documented evidence to put into their hands ... not that they ever open their minds to the point of seriously looking at it.
I track corporate media mostly through NPR news, which I can listen to in the background ... except when it turns into such blatantly corporate propaganda that I have to turn it off. Today, while maintaining their usual cheery spin on economic news, NPR News did fulfill their obligation to mention -- and even briefly explain -- the matter of people dropping out of the officially counted labor force.
You have to dig into the nitty gritty of this report
which is why I went through this top level calculation to show, once again, more people have dropped out of the count. I saw the most ridiculous manipulation by Forbes as well, so bad, not even going to link to it, but Paul Krugman breaks down the employment to population ratios by ages 25-54 to show, nope, this is not just people aging as the reason they are falling off of the count, these are prime workers falling into the not in the labor force black hole.
Dispelling headline buzz is the main reason I started overviewing these government reports in such detail. The spin is overwhelming!
But some are claiming these ratios are bound to fall and I don't buy it. i.e. participation rates and employment to population ratios. I'll wait until February when the 2010 Census data is incorporated and then we'll see what's going on.