The June 2010 monthly unemployment figures are out. The unemployment rate decreased to 9.5% and the total jobs lost were -125,000. 225,000 temporary government Census jobs were lost and private sector jobs increased 83,000. Minus the Census jobs, total jobs created was 100,000. 79,000 permanent jobs were created in June 2010.
Total nonfarm payroll employment declined by 125,000 in June, and the unemployment rate edged down to 9.5 percent, the U.S. Bureau of Labor Statistics reported today. The decline in payroll employment reflected a decrease (-225,000) in the number of temporary employees working on Census 2010. Private-sector payroll employment edged up by 83,000.

Below is the nonfarm payroll, seasonally adjusted:

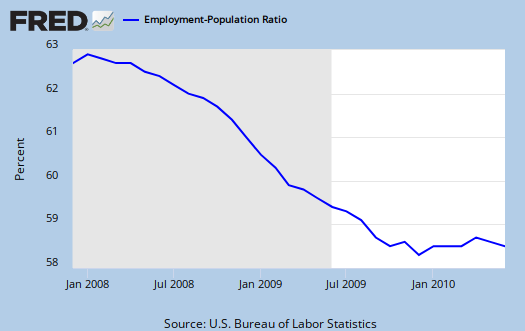
The civilian labor force participation rate dropped -0.3% in June to 64.7%. The employment to population ratio dropped -0.2% to 58.5%.
That means there are more employed people to the civilian non-institutional population, as a ratio, than last month (see graph below), which reduces the unemployment rate, but doesn't erase the people now destitute and not being counted.

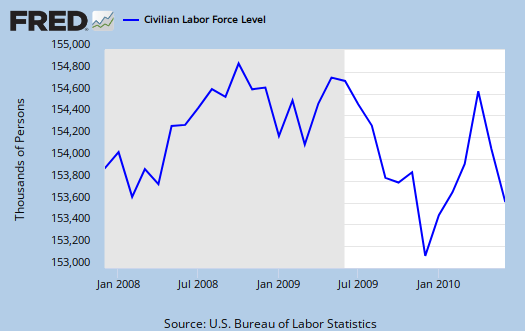
Those not in the labor force increased by 842,000. The civilian labor force decreased by -652,000. Of those in the civilian labor force, employed, dropped -301,000 in May, yet those unemployed dropped -350,000. This explains the overall drop in the unemployment rate, people simply dropped out of the count beyond the end of the temporary Census jobs.
Of those unemployed the number of re-entrants, or people trying again, dropped -145,000. New entrants into the job market who don't have a job dropped -66,000.


- Long term unemployed - 6.8 million
- Forced Part Time - 8.6 million
- Marginally attached to the labor force - 2.6 million
Of the Marginally attached, 1.2 million are discouraged.

U6, or Total unemployed, plus all persons marginally attached to the labor force, plus total employed part time for economic reasons, as a percent of the civilian labor force plus all persons marginally attached to the labor force, (table A.15), was 16.5%. Then 45.5% of the official unemployed have been so for 27 weeks or longer, which is horrific, still approaching half.
One needs at least 100,000 and some estimate up to 300,000 permanent full time jobs, added each month to keep pace with U.S. civilian workforce population growth. That's not general population, that's the group needing a job. To even get back to pre-recession unemployment rate levels we need a good 400,000 jobs created each month. That's permanent jobs.
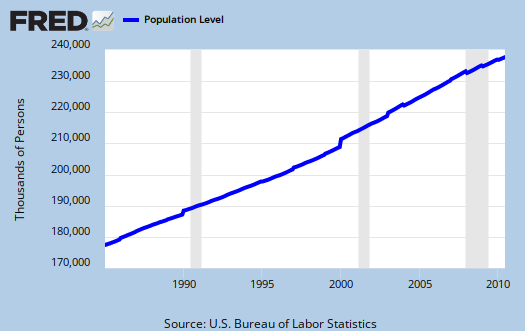
So, how did the unemployment rate tick down? Because more people stopped being counted. Below is the graph of the civilian non-institutional population, which is the largest super-set of the potential labor force, larger than the civilian workforce, due to those who are not looking for work, retired and so on being counted in this figure. It increased this month by 191,000. Unemployment is a percentage, a ratio.

In looking over table B1 we can get a little more detail on what kind of jobs were created (and lost) on the permanent jobs front. These sectors include temporary jobs.
- Financial: -15,000
- Information: -8,000
- Construction: -22,000
- Manufacturing: +9,000
- Mining & Logging: +5,000
- Health and Education: +22,000
- Leisure and Hospitality: +37,000
- Professional & Business Services: +46,000
- Trade, Transportation, Utilities: +7,000
- Government: -208,000
In Professional services, 21,000 jobs were temporary. There are still 339,000 temporary Census jobs bumping up artificially the non-farm payroll numbers. These jobs end sometime around September.
Construction now has a 20.1% unemployment rate.
You probably also want to know the birth/death model. What is that? It's a statistical adjustment to compensate for new businesses and dead businesses who are not actually tallied by data reports. Those jobs created and died outside the statistical reporting time window due to lag. So, the BLS estimates how many jobs can be attributed to those firms which are not actually counted. This month's adjustment was 147,000 jobs. Now one cannot directly subtract the birth/deal model monthly numbers, because unemployment data is seasonally adjusted, yet the birth/death adjustment is not seasonally adjusted, get that? Anywho, jobs attributed to new and dead businesses are just an estimate in so many words.
Notice this report does deviate from the ADP report of +13,000 private sector jobs vs. the BLS +83,000.
The average work week flat lined, an decrease of 0.1 hr. to 34.1 hrs/wk. Average earnings (drum roll please), decreased 2¢.
Here is last month's report. The BLS is reporting revisions to both April and May non-farm payrolls:
The change in total nonfarm payroll employment for April was revised from +290,000 to +313,000, and the change for May was revised from +431,000 to +433,000.

Incidents of Class War in the Jobs Report
There was a marginal increase in Total Personal Income last month and wages and work hours declined and the size of the work week dropped. The increase in personal income for a long time running has not come from wages, but from business income, dividends, transfers, interest and other unearned income.
No one should miss that Professional Services category increased while there was a drop in construction, IT, and the Government Census jobs.
Of course, you make the excellent point that the work force as a percent of population drops. So never have so few continued to make so much when so many became unemployed, while the homeless refugee population explodes.
Burton Leed
Andy Grove on Re-Industrializing
Andy Grove former chief of Intel is suggesting a path to rebuilding the manufacturing base. It is worth reading because of its source.
http://www.businessweek.com/magazine/content/10_28/b4186048358596.htm
Burton Leed
Andy Grove article
It is spot on. I think he should put together a policy paper to force U.S. advanced Silicon (processors, chips, iphones, etc.) manufacturing to return to the U.S. He hits upon a series of ideas but it could use to be more specific.
He's not exactly a "people person" in terms of giving a rats ass about workers so this article was quite a shocker!
But since he's piping up, he knows first hand exactly how to make advanced technology companies, the entire technology sector, to start manufacturing in the U.S.
One thing he didn't hit on, which is another dimension is shipping manufacturing of advanced technology to China is a national security issue as well.
Anywho, that was a very concise, accurate article and is a "must read".
foreign born unemployment stats
I just noticed something (I have a tendency to ignore demographics in statistics), that is probably going to piss people off regardless of whatever. But statistics are statistics and this is pretty damning frankly. Ok, the household survey (BLS) refuses to ascertain immigration status of anyone, which of course is critical because one doesn't know how many are on guest worker Visas, illegal, perm resident and most importantly, occupational sector. All they give is "foreign born" and "native born" and sexes. Foreign born just means those who were not born in this country. So, foreign born includes illegals as well as guest workers and also perm. res. (green card) and U.S. citizens (I believe). In other words, it's a pretty damn broad data point, but unfortunately includes a host of scenarios, such as guest workers and illegal labor, which are methods of global labor arbitrage against U.S. workers. There are estimated between 11-22 million illegals in the U.S.
With those caveats and cautions, I present table A-7 from the unemployment report. (natives is a labor economics term, please don't read anything more into it than that, means born in the U.S.)
The unemployment rate for natives is 9.8%. For foreign born it is 8.7%.
Read it and flip out. Recall, someone of Hispanic ethnicity does not imply their immigration status, i.e. U.S. citizens vs. illegals vs. perm res. vs. guest worker.
The Hispanic unemployment rate for June 2010 is 12.4%, but the participation rate decreased 0.5% and the "not in the labor force" (fell off of the count) increased 1.8%. The overall "not in the labor force" increased 1%.
So, in other words, whatever the "foreign born is", it is not by Hispanic ethnicity, they are hurting job wise and yes Hispanic ethnicity probably includes a a good percentage of illegals.
Because corporations are so adept at global labor arbitrage through manipulation of the U.S. immigration system and laws, the above is not good.
Sorry, read it and weep but the numbers imply something bad is happening for the U.S. workforce as a whole.
Census and Unemployment
In a strange, twisted way, I'm beginning to think that nutter Michelle Bachmann was on to something...I should never have submitted my Census form but should have instead forced the government to spend the extra cash to pay somebody to come knocking on my door. I'd much rather have my tax dollars go to have some otherwise unemployed person come to my door to figure out how many people live in my house than to have those dollars funneled into some plutocrat's already overflowing bank account. It seems the only way our Federal government will actually try to create jobs is if they are Constitutionally required to do so.
job creation through temp. Census workers
Myself, I've literally been at a loss for words after this unemployment report. I know of so many great policy changes that could revamp and help people get jobs, but the reason I'm silent is I also know this administration and this Congress will not even consider a single one of them. I am so disgusted and even more frightening is the country seems to be fracturing into some really nonsensical camps, specifically this "small government is the answer" and then on the left, you get special interest agendas which frankly most often do not add up by economic theory, macro econ.
It's like 1999 which is like 2001 which is like 2006 which is like 2008....
What are the people going to do? We cannot get representation and the choices are getting even more "weird" in terms of economic policy.
older workers getting screwed
A Calculated Risk reader tabled out the long term unemployment situation for those with a Bachelors degree or higher who have the misfortune of being over 45. It's bleak.
table here.
The age discrimination in this country is unbelievable. These are the very people who have enough experience they could literally drive new job creation yet instead of being utilized they are tossed overboard.
It's criminal.
That divide-and-conquer is best left to the neocons and neolibs.
I have to call bullshit on this age discrimination crap you keep peddling, just like you appear to be the only individual in the US of A who still accepts those fraudulent unemployment stats, after an almost limitless number of articles have been written by this date invalidating them.
It sounds like all that divide-and-conquer crap being peddled by think tanks, foundations and various astro-turf associations.
ALL American workers, by and large, are getting screwed. The ideal applicant pool, as far as the typical American company is concerned, has always been between 26 years and 31 years of age.
The minimum wage should be around $20 or $22 per hour. There is little future, and less opportunity for far too many workers in America today.
With a dramatically shrinking jobs base and tax base (and purposefully designed thusly), the vast majority of the citizenry are screwed.
It's not about one group against another, it's about the bank-oil cartel which controls the bulk of everything against the rest of us.
Any form of adding to their divide-and-conquer spin makes one highly suspicious of you and any underlying agendas.
Jesus James
yes all workers are getting screwed and obviously I do not believe the real number of people looking for a job is the unemployment rate, which is why I pour over raw data so much, amplifying the "not in the workforce" continually.
That said, I'm a numbers person, I'm a theory person and a mathematics head and I've yet to find anything better to examine. You hear me whine in almost every post about the labor market about the lack of enough statistics, accurate statistics....
Gez, you're hostile, I'm on your side.
austerity vs. government job creation
Yeah, it seems like our "leaders" are running off a cliff with this austerity thing. The groupthink of economic advice in official circles is truly depressing. The simple concept that, during a time of need, spending money or giving money to people that will spend it simply eludes those in power. Repeating something like the WPA, CCC, or the like just isn't even in the remotest corner of public discussion even though they'd be great. There are so many still existing things in my community that were done using the public employment programs of the New Deal...if all the things those programs did were marked in Google Earth the map of the country would be simply smothered in little dots. And yet, even with a crumbling infrastructure and idle hands all around, the idea doesn't even get a flicker of thought. Instead, ideology has blocked these and most other practical ideas out of the discussion.