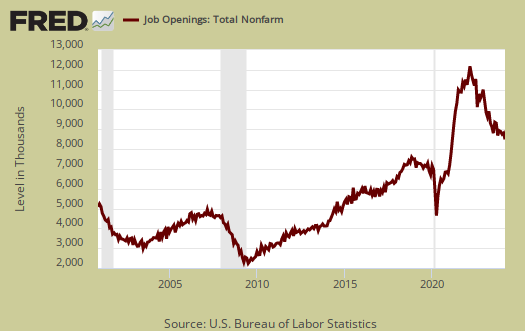
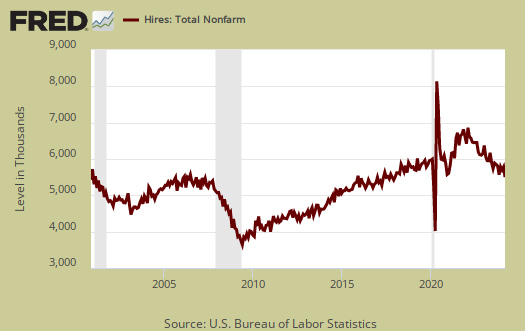
The BLS August 2016 JOLTS report shows once again job openings exceeding the number of hires. While the number of openings declined for the month, the number of hires stayed below it. The Job Openings and Labor Turnover Survey history clearly has hires exceeding openings as a trend since February 2015. For August, job openings were 5.4 million while hires were 5.2 million. The other bit of news JOLTS brings is that openings declined significantly for the month.
At the start of the recession, December 2007, there were 1.8 official unemployed persons per job opening. Below is the graph of the official unemployed per job opening, currently at 1.44 people per opening. This ratio is a tenth of a percentage point uptick from last month.

If one takes the U-6 broader measure of unemployment that includes people who are forced into part-time work and the marginally attached, the ratio is 2.87 people needing a job to each actual job opening. In December 2007 this ratio was 3.2.

Job openings for August declined by a whopping -388,000 Currently job openings stand at 5,443,000, which is still very high. One month does not a pattern make yet such a large drop is disconcerting.

Below is the graph of actual hires, currently 5,210,000. July hires were pretty much the same, 5,258,000. . Hires only near pre-recession levels, which is unbelievable considering that is now eight years ago. In December 2007, the first month of the recession, hires were 4,968,000. These numbers are not adjusted for increased population either, so that's actually worse than it sounds and backed by the still record low labor participation rates. In June 2009, the height of the recession, hires exceeded job openings by 1.2 million.

Graphed below are total job separations, currently at 4.954 million. The term separation means you're out of a job through a firing, layoff, quitting or retirement and is also called turnover. From a year ago, separations were 4.951 million, which is about as static as it gets in terms of statistics.

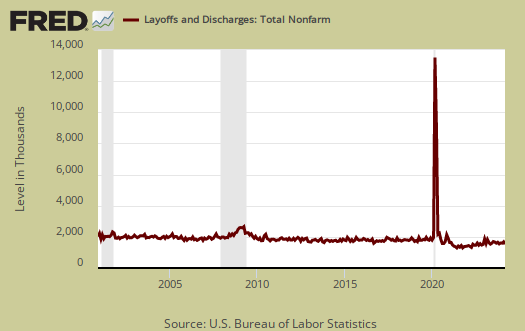
Layoffs and firings were 1.623 million., which is almost no change from both the previous month and a year ago. Below is a graph of just layoffs and firings to see the labor flow. Labor flow means the way people are hired, stay at a job, quit, get fired, get another job and so on. It is the overall flow of the labor market for as people are get jobs, they also lose them.

Graphed below are openings, separations and hires levels, so we can compare the types of labor flows. Labor is not static as people flow in an out of jobs. The level of unemployed in August was 7,849,000.

Graphed below are people who quit their jobs minus those who were fired and laid off. The lower the bar on the below graph, the worse labor conditions are. Quits are what they sound like, workers quit their current jobs often to obtain better ones. People feeling free enough to leave their current positions is considered a positive labor market sign. Quits were 2.981 million. A year ago quits were 2.855 million and quits are now near prerecession levels.

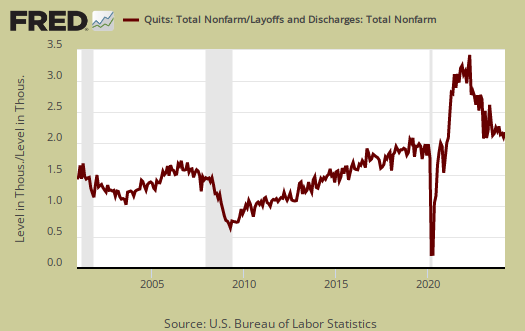
Below is a graph of the quits to layoffs ratio, currently at 1.84. This ratio of people who quit their jobs vs. those who were fired gives an indicator of worker churn as well as if there might be a shortage. If the ratio is below 1.0, this means more people are being laid off and fired than people who quit. When the ratio is much higher, this means more people quit their jobs and thus implies there is better opportunity elsewhere and workers feel free enough to move on to obtain those new better jobs. The quits to fires ratio was 1.9 in 2006.

For the year, there was a gain of 2.6 million employed and in spite of different employment reports the net job gains is lower than past months by about 100,000. The duration in so called permanent jobs these days can be very low, so due to labor flows the net gain of jobs over time belies the monthly headline buzz of jobs gained from the employment report. From the JOLTS report:
Over the 12 months ending in August, hires totaled 62.7 million and separations totaled 60.1 million, yielding a net employment gain of 2.6 million. These totals include workers who may have been hired and separated more than once during the year.
For the JOLTS report, the BLS creates some fairly useful graphs beyond the above and they have oodles of additional information in their databases, broken down by occupational area. That said, one doesn't know if the openings are quality jobs from the JOLTS statistics.
The JOLTS takes a random sampling of 16,000 businesses and derives their numbers from that. The survey also uses the CES, or current employment statistics, not the household survey as their base benchmark, although ratios are coming from the household survey, which gives the tally of unemployed.
The August 2016 unemployment rate was 4.9%. U-6 alternative unemployment rate was 9.7%. JOLTS includes part-time jobs and does not make a distinction between part-time, full-time openings. A job opening reported to the survey could literally be take out the trash twice a week and be counted. Here are our past JOLTS overviews, unrevised.

Recent comments