Calculated Risk

HVS: Q1 2024 Homeownership and Vacancy Rates

The Census Bureau released the Residential Vacancies and Homeownership report for Q1 2024 today.

The results of this survey were significantly distorted by the pandemic in 2020.
This report is frequently mentioned by analysts and the media to track household formation, the homeownership rate, and the homeowner and rental vacancy rates.  However, there are serious questions about the accuracy of this survey.

This survey might show the trend, but I wouldn't rely on the absolute numbers. Analysts probably shouldn't use the HVS to estimate the excess vacant supply or household formation, or rely on the homeownership rate, except as a guide to the trend.
National vacancy rates in the first quarter 2024 were 6.6 percent for rental housing and 0.8 percent for homeowner housing. The rental vacancy rate was not statistically different from the rate in the first quarter 2023 (6.4 percent) and virtually the same as the rate in the fourth quarter 2023 (6.6 percent).

The homeowner vacancy rate of 0.8 percent was virtually the same as the rate in the first quarter 2023 (0.8 percent) and not statistically different from the rate in the fourth quarter 2023 (0.9 percent).

The homeownership rate of 65.6 percent was not statistically different from the rate in the first quarter 2023 (66.0 percent) and not statistically different from the rate in the fourth quarter 2023 (65.7 percent).
emphasis added
Homeownership Rate Click on graph for larger image.

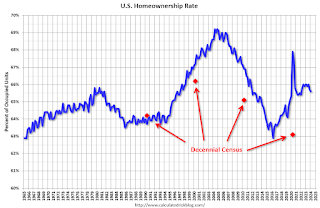
The Red dots are the decennial Census homeownership rates for April 1st, 1990, 2000, 2010, and 2020. 

The HVS homeownership rate decreased to 65.6% in Q1, from 65.7% in Q4.  
The results in Q2 and Q3 2020 were distorted by the pandemic and should be ignored.

Homeowner Vacancy Rate
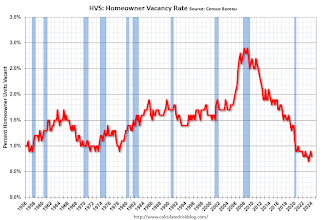
The HVS homeowner vacancy decreased to 0.8% in Q1 from 0.9% in Q4.

Once again - this probably shows the general trend, but I wouldn't rely on the absolute numbers.
The homeowner vacancy rate declined sharply during the pandemic and includes homes that are vacant and for sale (so this mirrors the low levels of existing home inventory).


Rental Vacancy RateThe rental vacancy rate was unchanged at 6.6% in Q1 from 6.6% in Q4.  This is up from the low of 5.6% in 2021 and 2022.

The quarterly HVS is the timeliest survey on households, but there are many questions about the accuracy of this survey.

Comments on February House Prices, FHFA: House Prices Up 7.0% YoY

Today, in the Calculated Risk Real Estate Newsletter: Case-Shiller: National House Price Index Up 6.4% year-over-year in February; FHFA: House Prices Increased in February, up 7.0% YoY

Excerpt:
S&P/Case-Shiller released the monthly Home Price Indices for February ("February" is a 3-month average of December, January and February closing prices). January closing prices include some contracts signed in October, so there is a significant lag to this data. Here is a graph of the month-over-month (MoM) change in the Case-Shiller National Index Seasonally Adjusted (SA).

Case-Shiller MoM House PricesThe MoM increase in the seasonally adjusted (SA) Case-Shiller National Index was at 0.41%. This was the thirteen consecutive MoM increase, and a larger MoM increase than the previous three months.

On a seasonally adjusted basis, prices increased month-to-month in 19 of the 20 Case-Shiller cities. Only Tampa saw a month-over-month decrease in February. Seasonally adjusted, San Francisco has fallen 8.2% from the recent peak, Seattle is down 6.1% from the peak, Portland down 4.0%, and Phoenix is down 3.1%.
There is much more in the article.

Case-Shiller: National House Price Index Up 6.4% year-over-year in February

S&P/Case-Shiller released the monthly Home Price Indices for February ("February" is a 3-month average of December, January and February closing prices).

This release includes prices for 20 individual cities, two composite indices (for 10 cities and 20 cities) and the monthly National index.

From S&P S&P CoreLogic Case-Shiller Index’s Upward Trend Persists in February 2024
The S&P CoreLogic Case-Shiller U.S. National Home Price NSA Index, covering all nine U.S. census divisions, reported a 6.4% annual gain in February, up from a 6.0% rise in the previous month. The 10- City Composite showed an increase of 8.0%, up from a 7.4% increase in the previous month. The 20- City Composite posted a year-over-year increase of 7.3%, up from a 6.6% increase in the previous month. San Diego continued to report the highest year-over-year gain among the 20 cities with an 11.4% increase in February, followed by Chicago and Detroit , with an increase of 8.9%. Portland, though still holding the lowest rank after reporting two consecutive months of the smallest year-over-year growth, had a significant increase in annual gain of 2.2% in February.
...
The U.S. National Index, the 20-City Composite, and the 10-City Composite, for the first time since November 2023, showed a pre-seasonality adjustment increase of 0.6%, 0.9% and 1.0% respectively.

After seasonal adjustment, the U.S. National Index posted a month-over-month increase of 0.4%, while the 20-City and the 10-City Composite both reported month-over-month increases of 0.6%.

“U.S. home prices continued their drive higher,” says Brian D. Luke, Head of Commodities, Real & Digital Assets at S&P Dow Jones Indices. “Our National Composite rose by 6% in January, the fastest annual rate since 2022. Stronger gains came from our 10- and 20-City Composite indices, rising 7.4% and 6.6%, respectively. For the second consecutive month, all cities reported increases in annual prices, with San Diego surging 11.2%. On a seasonal adjusted basis, home prices have continued to break through previous all-time highs set last year”
emphasis added
Case-Shiller House Prices Indices Click on graph for larger image.

The first graph shows the nominal seasonally adjusted Composite 10, Composite 20 and National indices (the Composite 20 was started in January 2000).

The Composite 10 index was up 0.6% in February (SA).  The Composite 20 index was up 0.6% (SA) in February.

The National index was up 0.4% (SA) in February.

Case-Shiller House Prices Indices The second graph shows the year-over-year change in all three indices.

The Composite 10 SA was up 8.0% year-over-year.  The Composite 20 SA was up 7.3% year-over-year.

The National index SA was up 6.4% year-over-year.

Annual price changes were above expectations.  I'll have more later.

Tuesday: Case-Shiller House Prices

Mortgage Rates From Matthew Graham at Mortgage News Daily: Mortgage Rates Sideways to Slightly Lower to Start New Week
Mortgage rates didn't change much at all over the weekend with the average lender still in the highest territory since November. The average conventional 30yr fixed rate is just under 7.5% for top tier scenarios.

Things could end up changing quite a bit by the end of this week owing to a slew of important events and economic reports. [30 year fixed 7.43%]
emphasis added
Tuesday:
• At 9:00 AM ET, S&P/Case-Shiller House Price Index for February. The consensus is for a 6.7% year-over-year increase in the Comp 20 index for February.

• Also at 9:00 AM, FHFA House Price Index for February. This was originally a GSE only repeat sales, however there is also an expanded index.

• At 9:45 AM, Chicago Purchasing Managers Index for April. The consensus is for a reading of 45.0, up from 41.4 in March.

• At 10:00 AM, the Q1 2024 Housing Vacancies and Homeownership from the Census Bureau.

Q1 2024 GDP Details on Residential and Commercial Real Estate

The BEA released the underlying details for the Q1 advance GDP report on Friday.

The BEA reported that investment in non-residential structures decreased at a 0.1% annual pace in Q1.  

Office Hotel Mall Investment as Percent of GDPClick on graph for larger image.

The first graph shows investment in offices, malls and lodging as a percent of GDP.

Investment in offices (blue) increased slightly in Q1 and was up 4.1% year-over-year.  And declined slightly as a percent of GDP.

Investment in multimerchandise shopping structures (malls) peaked in 2007 and was down about 1% year-over-year in Q1.   The vacancy rate for malls is still very high, so investment will probably stay low for some time.

Lodging investment decreased in Q1 compared to Q4, and lodging investment was up 1% year-over-year.
All three sectors - offices, malls, and hotels - were hurt significantly by the pandemic.  And the office vacancy rate is at a record high, and this will hold down office investment.

Residential Investment Components The second graph is for Residential investment components as a percent of GDP. According to the Bureau of Economic Analysis, RI includes new single-family structures, multifamily structures, home improvement, Brokers’ commissions and other ownership transfer costs, and a few minor categories (dormitories, manufactured homes).

Investment in single family structures was up to $433 billion (SAAR) (about 1.5% of GDP) and was up 16% year-over-year.

Investment in multi-family structures was down in Q1 compared to Q4 to $133 billion (SAAR), but still up 12% YoY.

Investment in home improvement was at a $351 billion (SAAR) in Q1 (about 1.2% of GDP).  Home improvement spending was strong during the pandemic but has declined as a percent of GDP recently.
Note that Brokers' commissions (black) increased sharply as existing home sales increased in the second half of 2020 but declined when mortgage rates increased.   Brokers' commissions were up 3% year-over-year in Q1.

Hotels: Occupancy Rate decreased 0.3% Year-over-year

From STR: U.S. hotel results for week ending 20 April
U.S. hotel performance showed mixed results from the previous week, according to CoStar’s latest data through 20 April. ...

14-20 April 2024 (percentage change from comparable week in 2023):

Occupancy: 66.8% (-0.3%)
• Average daily rate (ADR): US$158.60 (+1.5%)
• Revenue per available room (RevPAR): US$105.94 (+1.2%)
emphasis added
The following graph shows the seasonal pattern for the hotel occupancy rate using the four-week average.
Hotel Occupancy RateClick on graph for larger image.

The red line is for 2024, black is 2020, blue is the median, and dashed light blue is for 2023.  Dashed purple is for 2018, the record year for hotel occupancy. 
The 4-week average of the occupancy rate is tracking last year, and slightly above the median rate for the period 2000 through 2023 (Blue).

Note: Y-axis doesn't start at zero to better show the seasonal change.
The 4-week average of the occupancy rate will move mostly sideways seasonally until the summer travel season.

Energy expenditures as a percentage of PCE

During the early stages of the pandemic, energy expenditures as a percentage of PCE hit an all-time low of 3.3% of PCE. Then energy expenditures increased to 2018 levels by the end of 2021.
With the invasion of Ukraine, energy expenditures as a percentage of PCE increased further in 2022.

Here is an update through the March 2024 PCE report.

This graph shows expenditures on energy goods and services as a percent of total personal consumption expenditures.  This is one of the measures that Professor Hamilton at Econbrowser looks at to evaluate any drag on GDP from energy prices.
Energy Expenditures as Percent of PCE
Click on graph for larger image.

Data source: BEA.

In general, energy expenditures as a percent of PCE has been trending down for decades. The huge spikes in energy prices during the oil crisis of 1973 and 1979 are obvious. As is the increase in energy prices during the 2001 through 2008 period.

In August March 2024, energy expenditures as a percentage of PCE were at 4.1% of PCE, up from 4.0% in February, and down from the recent peak of 5.2% in June 2022. 
This is close to the pre-pandemic level of PCE.

Pages