
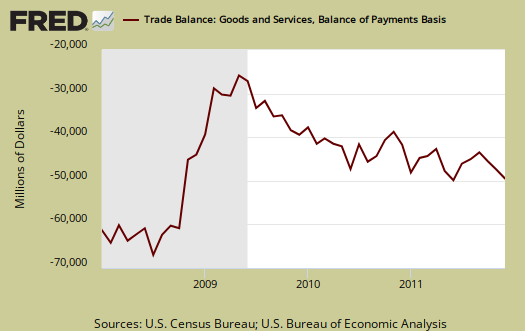
The December 2011 U.S. trade deficit increased $1.74 billion to $48.8 billion in a month. This is a 3.7% deficit increase from last month in the trade deficit. November's trade deficit was revised down by $694 million. December exports increased $1.23 billion, or -0.69%, while imports increased $2.97 billion, or +1.32%. The goods only trade deficit was -$64.3 billion. Services runs a surplus of $15.5 billion.
The China deficit alone was, -$23.136 billion, or 40.44% of the goods trade deficit for December. This includes oil, is not seasonally adjusted and is on a raw customs accounting basis. For comparison's sake the not seasonally adjusted goods trade deficit by Census accounting methods was -$57.21 billion. Many will claim that somehow this monthly China trade deficit drop of $3.75 billion means all is well. Not so. By country trade deficits are not seasonally adjusted and China's never ending import barrage is cyclical as one can see in the below graph of the deficit with China.

Oil related imports decreased -$0.24 billion with a petroleum end use trade deficit of -$26.94 billion, for December. Petroleum related end use is 42.43% of the goods trade deficit.
By the more specific to import types NAICS codes, not seasonally adjusted, oil and gas were 41.2% of the goods trade deficit, or $23 billion. Assuming China has very little oil and gas exports to the United States, if one subtracts off oil and gas from the goods trade deficit, China becomes very roughly 68% of the non-oil and gas goods trade deficit.
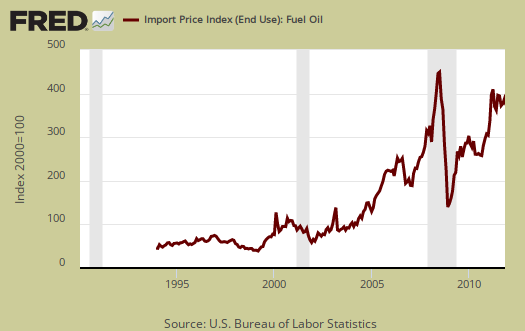
The United States basically has two major ongoing problems with the trade deficit, Chinese goods and Oil imports. Below is the not seasonally adjusted import price index for oil fuel. The average price for a barrel of oil in December was $104.13, up from November's price of $102.50. By volume, the U.S. imported 278,928 barrels of crude oil in December. November's crude oil import quantity was 266,216 barrels. Total energy petroleum related imports were 341,751 barrels for December.
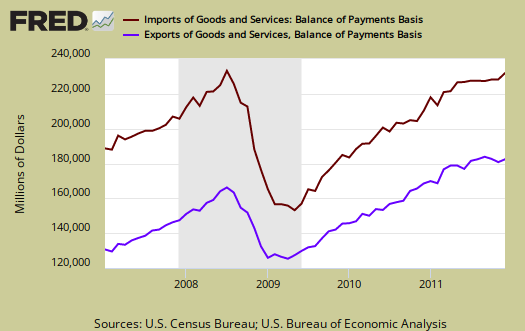
Below are imports vs. exports of goods and services from January 2007 to December 2011. Notice how much larger imports are than exports, but also notice the growth, or rate of change between months of U.S. exports over time. To state the obvious, imports subtract from GDP and exports add.
Below is the list of good export changes from November to December, seasonally adjusted. Of industrial supplies, believe this or not, the largest increase was $1,064 billion in fuel oil exports. The drop in consumer goods is primarily pharmaceutical preparations, which declined -$0.839 billion.
- Automotive vehicles, parts, and engines: +$0.674 billion
- Industrial supplies and materials: +$0.985 billion
- Other goods: +$0.326 billion
- Foods, feeds, and beverages: +$0.154 billion
- Capital goods: -$0.153 billion
- Consumer goods: -$1.008 billion
Exhibit 7 gives Census accounting method breakdown for exports.
Here are the goods import monthly changes, seasonally adjusted. While crude oil increased $0.817 billion, fuel oil imports dropped -$0.801 billion. We imported $29.287 billion in crude oil by this breakdown. Within capital goods, which doesn't include autos, we see civilian aircraft imports increase $444 million, while exports of civilian aircraft decreased -$370 million. Similarly, as we saw a decrease in pharmaceutical preparations exports, imports in pharmaceutical preparations increased $660 million. Are we seeing offshore outsourcing in one month's of trade data?
- Industrial supplies and materials: +$0.323 billion
- Capital goods: +$1.031 billion
- Foods, feeds, and beverages: -$0.097 billion
- Automotive vehicles, parts, and engines: +$0.534 billion
- Consumer goods: +$0.940 billion
- Other goods: +$0.013 billion
Running a trade deficit in advanced technology is not a good sign for those jobs of tomorrow. This month the advanced technology deficit dropped to a mere $8 billion (sic).
Advanced technology products exports were $26.2 billion in December and imports were $34.2 billion, resulting in a deficit of $8.0 billion. December exports were $1.3 billion more than the $24.9 billion in November, while December imports were $1.5 billion less than the $35.7 billion in November.
Here is the breakdown with major trading partners, not seasonally adjusted. China is the worst trade deficit, as detailed above.
OPEC can be assumed to be oil and the OPEC nations are: Algeria, Angola, Ecuador, Iran, Iraq, Kuwait, Libya, Nigeria, Qatar, Saudi Arabia, United Arab Emirates, Venezuela.
The December figures show surpluses, in billions of dollars, with Hong Kong $2.5 ($3.2 for November), Australia $1.7 ($1.5), Singapore $1.3 ($1.0), and Egypt $0.2 ($0.1).
Deficits were recorded, in billions of dollars, with China $23.1 ($26.9), European Union $9.6 ($9.7), OPEC $9.1 ($9.1), Japan $6.5 ($6.2), Mexico $4.9 ($5.5), Germany $4.8 ($4.7), Canada $3.9 ($3.0), Ireland $2.8 ($2.8), Venezuela $2.0 ($1.9),
In 2008, we broke monthly total trade deficit figures of $60 billion. This includes goods and services. We'll be analyzing annual trade figures in another article, check back soon.
Here is November's report overview (unrevised, although graphs are updated). Here is the BEA website for additional U.S. trade data.
You might ask what are these Census Basis versus Balance of Payment mentioned all over the place? The above mentions various accounting methods so we're comparing Apples to Apples and not mixing the fruit. The trade report in particular is difficult due to the mixing of these two accounting methods and additionally some data is seasonally adjusted and others are not. One cannot compare values from different accounting methods and have that comparison be valid.
In a nutshell, the Balance of Payments accounting method is where they make a bunch of adjustments to not count imports and exports twice, the military moving stuff around or miss some additions such as freight charges. The Census basis is more plain raw data the U.S. customs people hand over which is just the stuff crosses the border. The 2005 chain weighted stuff means it was overall modified for a price increase/decrease adjustment in order to remove inflation and deflation time variance stuff.
Bottom line, you want just the raw data of what's coming into the country and going out, it's the Census basis and additionally the details are only reported in that accounting format. Additionally the per country data is not seasonally adjusted so watch out trying to add those numbers into the overall trade deficit. It's a statistical no-no to mix seasonal and non-seasonally adjusted numbers.
The Census is also getting into the graphing game with some nice pie charts breaking down exports by country, as well as a chart showing petroleum as an overall percentage of the trade deficit.
Recent comments