America has a problem, a big one, the middle class has been wiped out. It is economic genocide and the target is most of America. The statistics just continue to pour in on how poorly America is doing. Even as the great manufactured crisis is over in D.C., the political agenda once again has nothing to do with helping America's middle class. Why jobs are not job #1 by this government we do not know.
Did you know 15% of America lives in poverty and that income for households after adjusting for inflation has declined by 8.3% since 2007? That America is making 9% less in real dollars than in 1999? The latest annual Census report for 2012 shows America is still broken and poor.
Did you know the United States has the worst income inequality of any industrialized nation? So says the OECD in this study. Globally, income inequality has increased more from 2007 to 2010 than during the twelve years previous and America is sure enough #1.
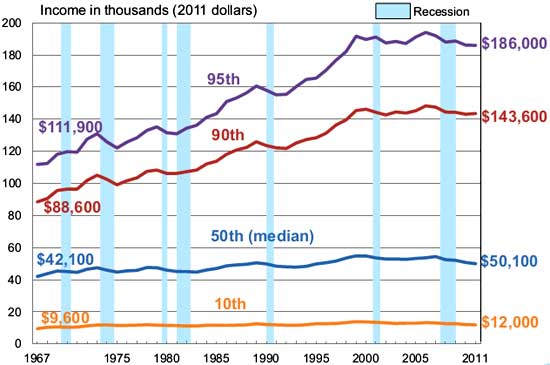
Most of America is poor, broke, and getting poorer. So shows new Census statistics for 2011. Real median income for households declined 1.5% to $50,054 and has declined for the second year in a row. The household median income is 8.1% lower than 2007 and 8.9% lower than 1999! The median belies the growing income inequality in the United States. Below is the Census graph of real household income by selected percentiles and illustrates our tragic unequal state. The top 5% increased their income by 66.2% while the the median income has only increased 19% since 1967. Real means inflation is removed.
A most interesting study came out of the left leaning Institute for Policy Studies. They found 26 corporations paid more to their CEO than they actually paid in taxes. IPS compared executive compensation to how much tax write offs that pay package gives and conclude excessive compensation is a tax on you. Corporations are raking it in and not paying much to Uncle Sam. CEOs aren't being rewarded for actual performance, the excessive pay is more reflective on our loophole ridden corporate tax code. IPS estimates CEO pay at 26 firms is equivalent to a $46 dollar tax on every person in America, or $14.4 billion per year.
Of last year’s 100 highest-paid U.S. corporate chief executives, 26 took home more in CEO pay than their companies paid in federal income taxes, up from the 25 we noted in last year’s analysis. Seven firms made the list in both 2011 and 2010.
Once again, low corporate tax bills, or large refunds, cannot be explained by low profits. On average, the 26 firms had more than $1 billion in U.S. pre-tax income but still received net tax benefits that averaged $163 million.
The CEOs of these 26 firms received $20.4 million in average total compensation last year. That's a 23 percent increase over the average for last year’s list of 2010's tax dodging executives.
Two of the firms that paid their CEOs more than Uncle Sam, Citigroup and AIG, owe their very continued existence to taxpayer bailouts.
Combined, the 26 firms have 537 subsidiaries in tax-haven countries such as the Cayman Islands, Bermuda, and Gibraltar.


 A most interesting study came out of the left leaning
Recent comments