Previously in Part I of this series, I explained the need to re-examine economic indicators to determine how they performed in previous periods of deflation. In Part II, I looked at the year-over-year M1 vs. CPI indicator during the Roaring Twenties. That examination showed that, in the 1920s, the M1 vs. CPI indicator generally worked well, with two differences from the Inflationary Era: (1) if anything, the indicator slightly lagged signaling the start of recessions, and led signaling expansions; and (2) when M1 was not growing -- when it was stagnant or declining -- it did not signal expansion even though its YoY change was less negative than a CPI deflation.
III. Great Depression, post WW 2 deflation -- monetary indicators
In this installment I will look at the same M1 vs. CPI indicator during the Great Contraction and New Deal portions of the Great Depression, and the brief post World War 2 deflation of 1948-49 (the last significant period of deflation before now).
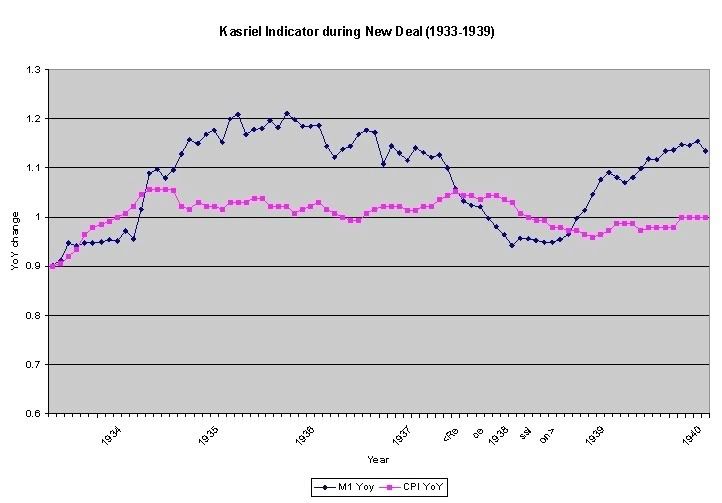
Before we examine the Great 1929-1932 Contraction, let's look at the Recesion of 1937-38 (as previously, YoY M1 is in blue, CPI is in red):

As with the Roaring Twenties, our monetary indicator works flawlessly here, with M1 declining below CPI in June 1937, only one month after the onset of the recession in May 1937, and exceeding CPI in August 1938, two months after its end in June 1938.
Recent comments