Business Inventories, or Manufacturing and Trade Sales and Inventories, show a 1.1% increase in sales and an 0.8% increase in inventories for December. Earlier, wholesale inventories, about a third of all inventories, reported earlier, also showed a 1.0% increase for December.
Business Inventories, or Manufacturing and Trade Sales and Inventories, show a 1.2% increase in sales but only a 0.2% increase in inventories in comparison to October. Earlier, wholesale inventories, about a third of all inventories, also showed a deceleration in growth.
New Orders in Durable Goods dropped 3.3% for October 2010, but last month's 3.3% increase was revised up to 5%. New orders has declined 3 of the past 5 months. New orders in non-defense capital goods decreased -4.5%. Core capital goods new orders also fell -4.5%.
The Manufacturing, Trade, Inventories & Sales for April 2010 is out. Sales were down, -0.9% and inventories up 0.1% for the month. For manufacturers sales were down -1.3%, for retailers down -1.2%. Merchant wholesalers had a 0.3% rise in business sales.
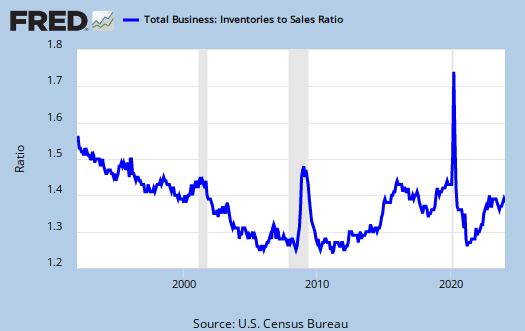
Below is a graph of the sales to inventories ratio. As you can see the ratio has become flat, which implies businesses are simply keeping on hand what they believe they can sell. It represents only a 1.23 months supply of inventories, given the current sales rate.
Below is a graph of raw inventory changes. Notice inventories are nowhere near pre-recession levels.
Sales were up 2.0% from October 2009 and Inventories were up 0.4% from October 2009.
For the year to year comparison, sales are still down 0.4% from November 2008 and inventories were down 11.1% from November 2008. Remember in November 2008 the official recession has gone on for 11 months.
Sales to inventory ratios is now 1.28 for the month. This is actually good, yet don't get your panties all in a bunch until you read the below on wholesale data, released earlier in the week.
The more the inventory/sales ratio returns to pre-recession levels the more it is implied hiring will begin to manufacture new goods. Of course that also requires demand return to pre-recession levels.
Inventories data came out today and showed we have the biggest decline in inventories in history of the index, 1.5%. Here is the inventory to sales ratio graph, which is actually good. The more manufacturers run out of stuff on the shelves with new orders, the more they have to make stuff and hire people to make the stuff.
Sales. The U.S. Census Bureau announced today that the combined value of distributive trade sales and manufacturers’ shipments for August, adjusted for seasonal and trading-day differences but not for price changes, was estimated at $989.6 billion, up 1.0 percent (±0.2%) from July 2009 and down 15.1 percent (±0.4%) from August 2008.
New orders for manufactured goods in August, down following four consecutive monthly increases, decreased $2.8 billion or 0.8 percent to $352.9 billion, the U.S. Census Bureau reported today. This followed a 1.4 percent July increase. Excluding transportation, new orders increased 0.4 percent.
More bad news on new orders for durable goods, down 2.6%:
New orders for manufactured goods in June, up four of the last five months, increased $1.4 billion or 0.4 percent to $349.0 billion, the U.S. Census Bureau reported today. This followed a 1.1 percent May increase.
Excluding transportation, new orders increased 2.3 percent. Shipments, up following ten consecutive monthly decreases, increased $4.9 billion or 1.4 percent to $358.3 billion. This followed a 0.8 percent May decrease.
Unfilled orders, down nine consecutive months, decreased $6.5 billion or 0.9 percent to $740.2 billion. This was the longest streak of consecutive monthly decreases since November 2001-July 2002. This followed a 0.3 percent May decrease.


Recent comments