
Yippie! Horray! Unemployment decreased in 36 States! Oops, but wait! Guess what. That isn't because we had an increase in jobs.....it's looking like we have people being dumped off the rolls and no longer counted. Isn't is so lovely how our government reports unemployment? You're broke, desperate, now living in a box and you're no longer even counted in the tally.
I digress. Onto the BLS report.
Thirty-six states and the District of Columbia recorded over-the-month unemployment rate decreases, 8 states registered rate increases, and 6 states had no rate change.
Onto actual job creation:
Nonfarm payroll employment increased in 19 states and decreased in 31 states and the District of Columbia.
So, what a set of mixed messages, eh? The unemployment rate is down but AP claims people dropped off the rolls?
Let's try to get to the bottom of this report and determine if it's good news, bad news or both, as well as sift through the spin as well as the statistical noise.
Ok, firstly, let's look at the maps contained within the report.
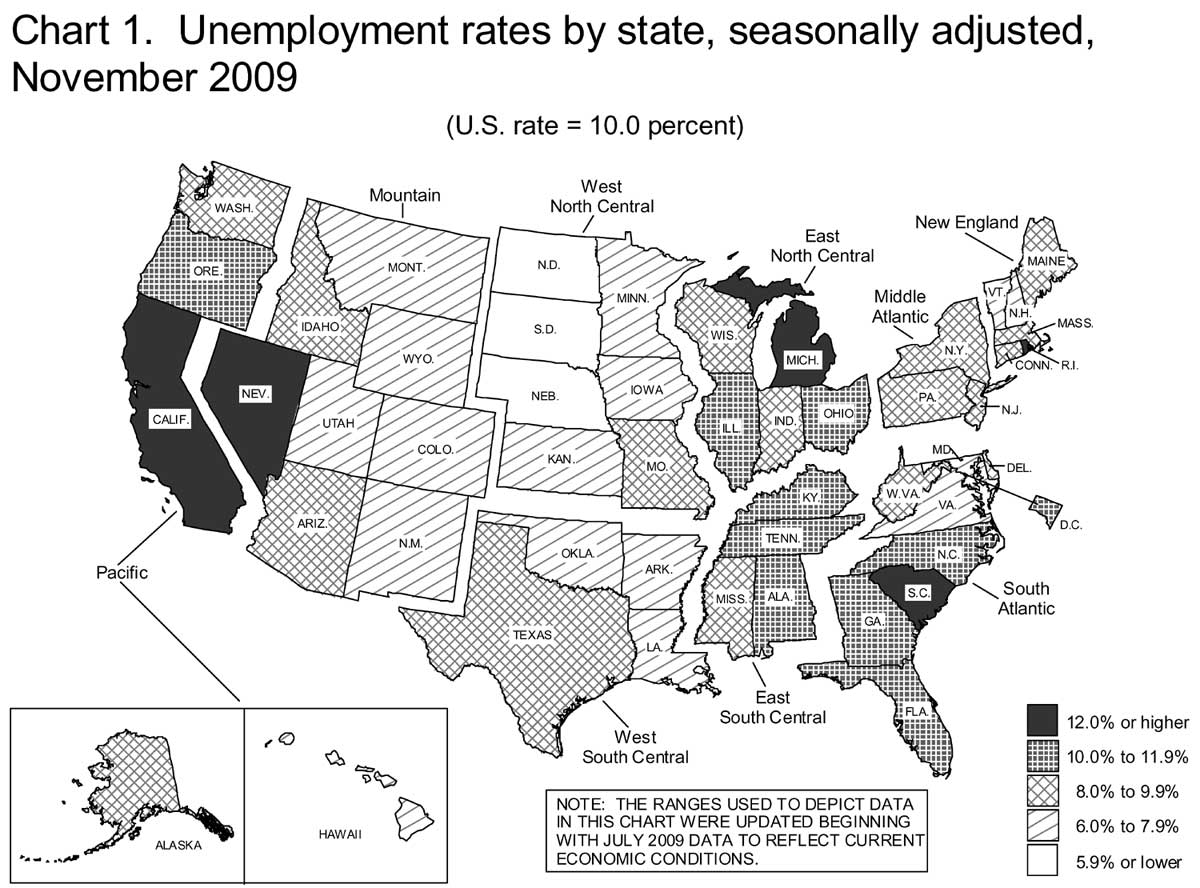
Click map to enlarge
Above is the unemployment rate for all states. Now below is the non-farm payrolls (i.e. the number of jobs), and the yearly change for all states:
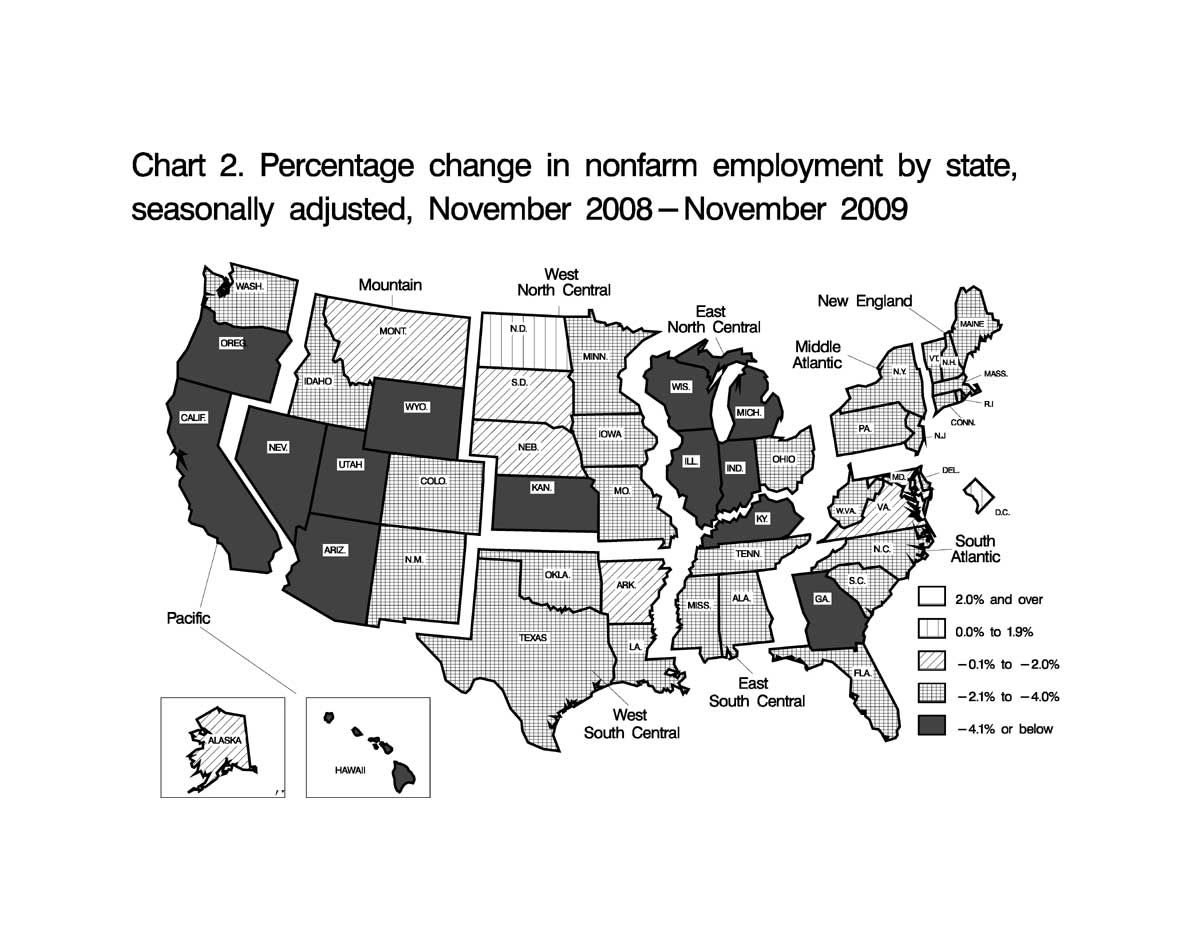
Click map to enlarge
So, what? What does this tell me about this month? I tabulated the below table to gain some insight:
State Non-Farm Payroll/Unemployment Rate
Oct./Nov. 2009: 1-Month Net Change
| State |
Payroll Change |
Unemployment Rate Change |
|---|---|---|
| Alabama |
-1.1%
|
-0.4%
|
| Alaska |
1.5%
|
0.0%
|
| Arizona |
4.3%
|
-0.4%
|
| Arkansas |
0.4%
|
-0.2%
|
| California |
-10.2%
|
-0.2%
|
| Colorado |
1.8%
|
-0.1%
|
| Connecticut |
-2.6%
|
-0.6%
|
| Delaware |
-2.0%
|
-0.1%
|
| District of Columbia |
-2.5%
|
-0.1%
|
| Florida |
-16.7%
|
0.2%
|
| Georgia |
4.8%
|
0.1%
|
| Hawaii |
-6.0%
|
-0.3%
|
| Idaho |
1.1%
|
0.1%
|
| Illinois |
-6.3%
|
-0.1%
|
| Indiana |
-6.4%
|
-0.2%
|
| Iowa |
4.3%
|
0.1%
|
| Kansas |
-3.5%
|
-0.4%
|
| Kentucky |
-4.9%
|
-0.7%
|
| Louisiana |
-0.6%
|
-0.7%
|
| Maine |
-3.3%
|
-0.2%
|
| Maryland |
-1.9%
|
0.1%
|
| Massachusetts |
-1.7%
|
-0.1%
|
| Michigan |
-14.0%
|
-0.4%
|
| Minnesota |
2.0%
|
-0.2%
|
| Mississippi |
-6.1%
|
-0.2%
|
| Missouri |
-3.5%
|
0.2%
|
| Montana |
-2.5%
|
0.0%
|
| Nebraska |
1.6%
|
-0.4%
|
| Nevada |
-8.8%
|
-0.6%
|
| New Hampshire |
-1.5%
|
-0.1%
|
| New Jersey |
-9.4%
|
0.0%
|
| New Mexico |
1.0%
|
0.0%
|
| New York |
-6.1%
|
-0.4%
|
| North Carolina |
-8.8%
|
-0.1%
|
| North Dakota |
0.1%
|
-0.1%
|
| Ohio |
5.4%
|
0.1%
|
| Oklahoma |
-6.0%
|
-0.3%
|
| Oregon |
-4.6%
|
-0.1%
|
| Pennsylvania |
-10.2%
|
-0.4%
|
| Rhode Island |
-1.3%
|
-0.2%
|
| South Carolina |
0.2%
|
0.2%
|
| South Dakota |
0.7%
|
0.0%
|
| Tennessee |
0.4%
|
-0.2%
|
| Texas |
17.3%
|
-0.3%
|
| Utah |
-5.8%
|
-0.2%
|
| Vermont |
0.3%
|
-0.1%
|
| Virginia |
0.1%
|
0.0%
|
| Washington |
-7.5%
|
-0.1%
|
| West Virginia |
1.7%
|
-0.1%
|
| Wisconsin |
-8.6%
|
-0.2%
|
| Wyoming |
-0.1%
|
-0.2%
|
| Nov. Preliminary | ||
In the above table, each state has the net percentage change in total jobs, otherwise known as nonfarm payroll, and the net percentage change in the unemployment rate.
A negative number in payroll means a loss of jobs, by percentage, in that state. A negative number in the unemployment rate means the rate dropped, which one would think implies more people got a job. Oops, not so. A positive number in the unemployment rate means the official tally of those without jobs increased.
In the above table, one can see a drop (negative) in the unemployment rate from October yet also see a net loss percentage of jobs. So, when both numbers are negative, and the unemployment rate percentage change (drop) is larger, chances are people plain fell off of the unemployment insurance rolls and are no longer counted. When the net change in payroll is positive and the unemployment rate change is negative, that's good, odds are it means some people got a job. When the net change in payroll is positive and the unemployment is positive, that could mean folks came out of the woodwork and started looking for work, officially through the unemployment office. When the spread is huge, say Connecticut's unemployment rate decreased dramatically but look at the percentage of jobs(payroll) lost, that implies a lot of people potentially fell off of the unemployment rolls and are no longer counted.
When you see a dramatic jump in jobs, yet not that big of a change in the unemployment rate dropping, such as Texas, one must wonder what's going on since payroll is a percentage change, tabulated from the BLS stats and this conclusion is different from what AP reported as statistically insignificant. Guest workers perhaps?
So, I would say overall this isn't very good news, especially for Michigan in spite of the tantalizing headline the unemployment rate dropped in 36 states. While one sees some whopping negative percentages in terms of payroll about the only state to get a whopping plus in job creation is Texas.
Unemployment/Cobra Subsidies passed Senate
This should make a lot of people happy but will also expose the real long term unemployment a little more.
The Senate passed (the House did earlier) unemployment benefit extensions until Feb. 28 for those due to expire on Dec. 31.
state population and employment rates
What would be interesting is a third column for population size. Then sort by population size and compute averages for quartiles.
I couldn't find a break down by state
in the databases. It's probably somewhere (and it has to be updated monthly) but I couldn't locate it.
If you find it, please post another comment and I will add it.
Chickens come home to roost!
The map shows a great deal of where people live in the "real economy." Florida has hit 11.5% unemployement -- but things are worse in Michigan, California, Nevada, and SC. There are some hopeful signs, but can't come fast enough. Add the blizzards to that and we may see a realignment of values -- instead of the usual obscene spending, let's feed the hungry and homeless this year. I do my christmas shopping at the local food market and place my gifts in the bin for the food bank near the exit. Beats hell out of buying a bunch of "Made in China" neckties people don't really want (and won't wear).
Now, as for the religious side of the holiday, we should all join with Father (or Rabbi) Ben and pray for inflation --it's what the Fed really wants for Christmas. What will he give the middle class in the way of mortgage relief?
Frank T.
Frank T.
If they really wanted to create demand
they would have given people mortgage debt forgiveness instead of re-inflating asset prices.
RebelCapitalist.com - Financial Information for the Rest of Us.
RebelCapitalist.com - Financial Information for the Rest of Us.
All I want for Christmas
A letter I found on the Internets (;)):