
The July 2010 monthly unemployment figures are out. The official unemployment rate remained at 9.5% and the total jobs lost were -131,000. 143,000 temporary government census jobs were lost and private sector jobs increased by 71,000. Minus the census jobs, total jobs created was 12,000.
Total nonfarm payroll employment declined by 131,000 in July, and the unemployment rate was unchanged at 9.5 percent, the U.S. Bureau of Labor Statistics reported today. Federal government employment fell, as 143,000 temporary workers hired for the decennial census completed their work. Private-sector payroll employment edged up by 71,000.

Below is the nonfarm payroll, seasonally adjusted. Notice the downward slope of the number of actual jobs.

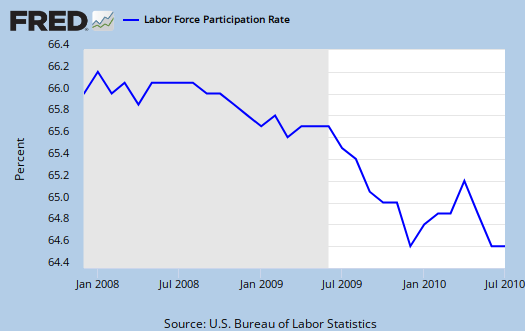
The civilian labor force participation rate dropped -0.1% in June to 64.6%. The employment to population ratio dropped -0.1% to 58.4%.
That means when there are more employed people to the civilian non-institutional population, as a ratio, it reduces the unemployment rate. A percentage is a ratio and many people are not counted in the official unemployment statistics. That official rate does not erase the very real people who are now destitute and not being counted.

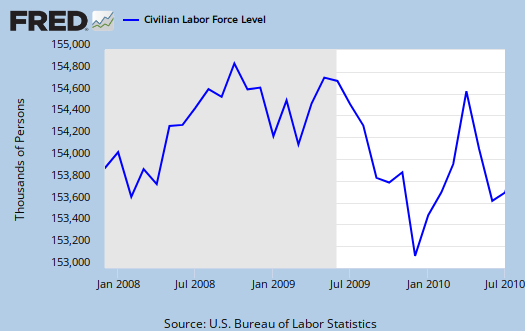
Those not in the labor force increased by +381,000. The civilian labor force decreased by -181,000. Of those in the civilian labor force, employed, dropped -159,000 in July, yet those unemployed dropped -24,000. This explains the no change in the unemployment rate, people just dropped from the rolls, new people added to the participation rate.
More interesting the civilian population rose by 200,000, or 0.0% last month.
Of those unemployed the number of re-entrants, or people trying again, increased by +85,000. New entrants into the job market who don't have a job increased +48,000.
More telling, the change in the number of people who voluntarily left their jobs in July, zero. Most suspicious, the BLS claims only 11,000 more people were fired or completed temporary jobs than last month. This seems hard to believe with the loss of 143,000 Census jobs.
The change in those unemployed and counted was -179,000. The change of the newly unemployed was +70,000.
- Long term unemployed - 6.6 million
- Forced Part Time - 8.5 million
- Marginally attached to the labor force - 2.6 million
Of the Marginally attached, 1.2 million are discouraged.

U6, or Total unemployed, plus all persons marginally attached to the labor force, plus total employed part time for economic reasons, as a percent of the civilian labor force plus all persons marginally attached to the labor force, (table A.15), was 16.5%. Then 45% of the official unemployed have been so for 27 weeks or longer. The long term unemployed percentage is staying at historical record highs.
One needs at least 125,000 and some estimate up to 300,000 permanent full time jobs, added each month just to keep pace with U.S. civilian workforce population growth. That's not general population, that's the group needing a job. To even get back to pre-recession unemployment rate levels we need a good 400,000 jobs created each month. That's permanent jobs.
Below is the graph of the civilian non-institutional population, which is the largest super-set of the potential labor force, larger than the civilian workforce, due to those who are not looking for work, retired and so on being counted in this figure. It increased this month by 200,000. Unemployment is a percentage, a ratio.
The BLS unemployment report counts foreign temporary guest workers as well as illegal immigrants in their U.S. labor force statistics.

In looking over table B1 we can get a little more detail on what kind of jobs were created (and lost) on the permanent jobs front. These sectors include temporary jobs.
- Financial: -17,000
- Information: +1,000
- Construction: -11,000
- Manufacturing: +36,000
- Mining & Logging: +8,000
- Health and Education: +30,000
- Leisure and Hospitality: +6,000
- Professional & Business Services: -13,000
- Trade, Transportation, Utilities: +25,000
- Government: -202,000
All of the manufacturing job gains were in durable goods. Professional services lost -5,600 temporary jobs. Bear in mind illegal workers and foreign guest workers are counted, which can distort occupational sectors, particularly the Science and Technology ones. Below are the unemployment rates per occupational sector:
- Financial: 6.4%
- Information: 10.6%
- Construction: 17.3%
- Manufacturing: 10.0%
- Mining & Logging: 10.1%
- Health and Education: 6.6%
- Leisure and Hospitality: 11.4%
- Professional & Business Services: 10.0%
- Trade, Transportation, Utilities: 9.2%
- Government: 5.5%
- Agricultural: 8.7%
- Self-employed, unpaid family: 5.9%
You probably also want to know the birth/death model. What is that? It's a statistical adjustment to compensate for new businesses and dead businesses who are not actually tallied by data reports. Those jobs created and died outside the statistical reporting time window due to lag. So, the BLS estimates how many jobs can be attributed to those firms which are not actually counted. This month's adjustment was 6,000 jobs. Now one cannot directly subtract the birth/deal model monthly numbers, because unemployment data is seasonally adjusted, yet the birth/death adjustment is not seasonally adjusted, get that? Anywho, jobs attributed to new and dead businesses are just an estimate in so many words.
Notice this report does deviate from the ADP report of +42,000 private sector jobs vs. the BLS +71,000.
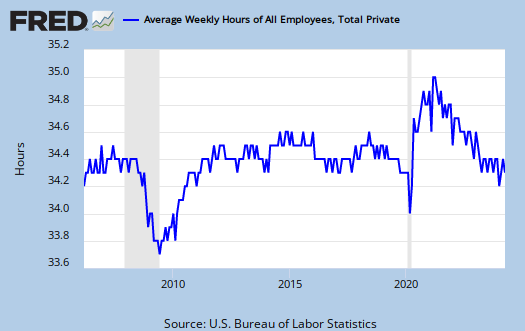
The average work week flat lined, an decrease of 0.1 hr. to 34.2 hrs/wk. Average earnings (drum roll please), increased 4¢. Only the manufacturing work week is above 40 hours or full time. When the number of hours per worker is below full time, beyond the labor implications, there also is a common practice among employers to keep workers part-time, in order to deny them benefits.
Here is last month's report. There were significant revisions to the past two unemployment reports:
The change in total nonfarm payroll employment for May was revised from +433,000 to +432,000, and the change for June was revised from -125,000 to -221,000.
June is off on job losses by almost 100,000. Wow, with accurate metrics like this who needs fictional fantasy?
12,000 jobs, reseached explanation
The jobs created is 12,000. It seems people are confused on the 71,000 instead of the 12,000. I wasn't, so I did not explain it.
Calculated Risk emailed the BLS to amplify the calculation, which I just did w/o explanation above.
So, the 71,000 is private, whereas the report includes government jobs too...
as a result, we get a whopping 12,000 job growth minus the loss of the temporary Census jobs.
Naked Capitalism on revisions
I commented briefly on the revisions, but over at Naked Capitalism we have someone who graphed them all out.
Tone Deaf
The Huffington Post has on their front page, in big bold letters TONE DEAF about the Obama administration as well as former treasury secretaries on the lack of jobs and the economy.
Rubins is one of them, no surprise, of course he's tone deaf, he's one of the original architects of destroying the U.S. economy and middle class!
Anyway, big bold letters about sums it up.
Brother can you spare a job?
visual video of unemployment maps.
Below someone took the BLS unemployment maps, month per month and made a video out of them. It's like watching the lights go out in America. Stops in May 2010. Bear in mind, this is the official unemployment rate, not the real rate, still horrific.