
The August 2010 monthly unemployment figures are out. The official unemployment rate increased to 9.6% and the total jobs lost were -54,000. 114,000 temporary government census jobs were lost and private sector jobs increased by 67,000, which is misleading for 10,000 of the private sector jobs were returning workers, who were on strike. Minus the census jobs, total jobs created was 60,000. This is not enough to even keep up with population growth. Job creation in America is missing in action.

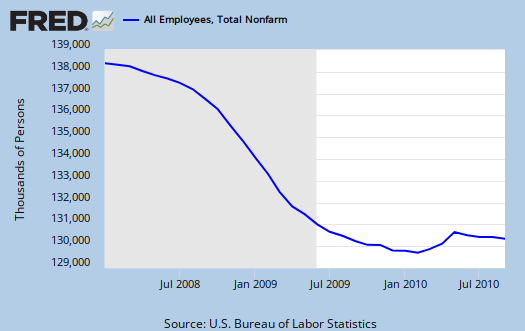
Below is the nonfarm payroll, seasonally adjusted. Notice the downward slope of the number of actual jobs.
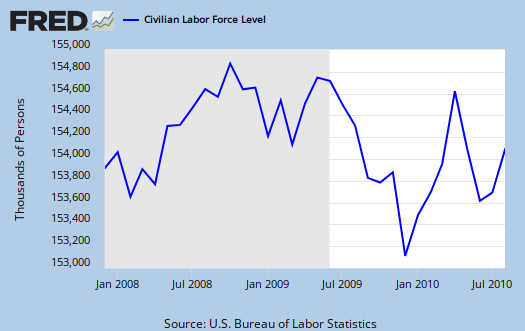
The civilian labor force participation rate increased +0.1% in August to 64.7%. The employment to population ratio increased +0.1% to 58.5%.
That means when there are less employed people to the civilian non-institutional population, as a ratio, it increases the unemployment rate. A percentage is a ratio and many people are not counted in the official unemployment statistics. unemployment goes up simply because more people are being counted.

Those not in the labor force decreased by -341,000. The civilian labor force increased by 550,000. Of those in the civilian labor force, employed, increased 290,000 in August, yet those unemployed increased 261,000. This explains the small change in the unemployment rate to 9.6%. Some people just dropped from the rolls, new people added to the participation rate, more people lost their jobs.
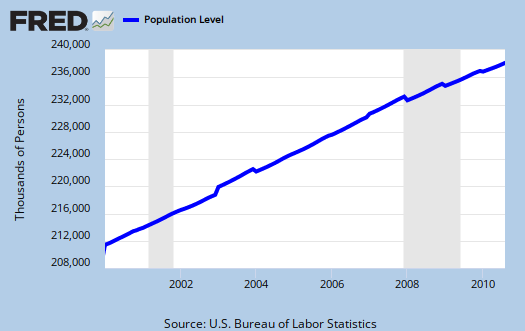
The civilian population rose by 209,000, or 0.0% last month. The civilian population now stands at 238,099,000. Yet those not in the labor force are now an astounding 83,421,000.
Of those unemployed the number of re-entrants, or people trying again, increased by +18,000. New entrants into the job market who don't have a job increased +71,000.
More telling, the change in the number of people who voluntarily left their jobs in August is -26,000. In other words, few are quitting their jobs these days. A very scary number, 180,000 people were fired from their jobs in August. Take away 114,000 Census workers, it's still 66,000, fired.

The change in those unemployed and counted was -179,000. The long term unemployed dropped by -323,000. But because we see no real job growth, this implies people are dropping from the count.
- Long term unemployed - 6.249 million
- Forced Part Time - 8.860 million
- Marginally attached to the labor force - 2.370 million
Of the Marginally attached, 1.110 million are discouraged. One of the most telling numbers is the increase in forced part time workers, up 331,000 in one month.
The number of part time workers in America is huge. 18,558,000 are part time for non-economic reasons, 8,860,000 for those forced to work part time because that's pretty much all they can get.

U6, defined as total unemployed, plus all persons marginally attached to the labor force, plus total employed part time for economic reasons, as a percent of the civilian labor force plus all persons marginally attached to the labor force, (table A.15), was 16.7%, a 2% increase from last month. This number is obscene. Then 42% of the official unemployed have been so for 27 weeks or longer.
One needs at least 125,000 and some estimate up to 300,000 permanent full time jobs, added each month just to keep pace with U.S. civilian workforce population growth. That's not general population, that's the group needing a job. To even get back to pre-recession unemployment rate levels we need a good 424,000 jobs created each month. That's permanent jobs.
Below is the graph of the civilian non-institutional population, which is the largest super-set of the potential labor force, larger than the civilian workforce, due to those who are not looking for work, retired and so on being counted in this figure. It increased this month by 209,000. Unemployment is a percentage, a ratio.
The BLS unemployment report counts foreign temporary guest workers as well as illegal immigrants in their U.S. labor force statistics.
In looking over table B1 we can get a little more detail on what kind of jobs were created (and lost) on the permanent jobs front. These sectors include temporary jobs. 16,800 of the jobs created were temporary. Notice that manufacturing lost 27,000 jobs in a month.
- Financial: -4,000
- Information: -1,000
- Construction: +19,000
- Manufacturing: -27,000
- Mining & Logging: +8,000
- Health and Education: +45,000
- Leisure and Hospitality: +13,000
- Professional & Business Services: +20,000
- Trade, Transportation, Utilities: -9,000
- Government: -121,000
-24,000 of the manufacturing job losses were in durable goods. Bear in mind illegal workers and foreign guest workers are counted as employed Americans, which can distort occupational sectors, particularly the Science and Technology ones. Below are the unemployment rates per occupational sector from table A-14. Government unemployment includes the recent temporary census workers. Look at how high professional and business services is.
- Financial: 6.7%
- Information: 9.7%
- Construction: 17.0%
- Manufacturing: 9.5%
- Mining & Gas, Oil: 10.9%
- Health and Education: 6.7%
- Leisure and Hospitality: 10.8%
- Professional & Business Services: 10.5%
- Retail, Wholesale Trade: 9.3%
- Government: 6.0%
- Agricultural: 7.9%
- Self-employed, unpaid family: 6.1%
You probably also want to know the birth/death model. What is that? It's a statistical adjustment to compensate for new businesses and dead businesses who are not actually tallied by data reports. Those jobs created and died outside the statistical reporting time window due to lag. So, the BLS estimates how many jobs can be attributed to those firms which are not actually counted. This month's adjustment was 115,000 jobs. Now one cannot directly subtract the birth/deal model monthly numbers, because unemployment data is seasonally adjusted, yet the birth/death adjustment is not seasonally adjusted, get that? Anywho, jobs attributed to new and dead businesses are just an estimate in so many words.
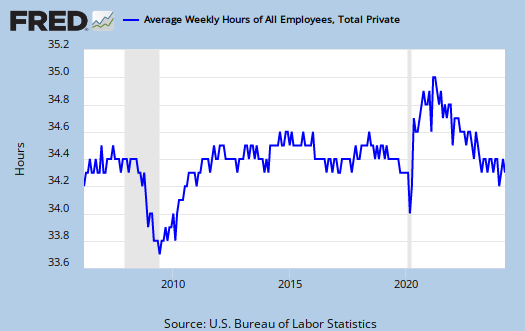
The average work week flat lined, 34.2 hrs/wk, same as last month. Average earnings (drum roll please), increased 6¢. What is astounding is how many industry sections are below full time. When the number of hours per worker is below full time, beyond the labor implications, there also is a common practice among employers to keep workers part-time, in order to deny them benefits.
Here is last month's report. There were significant revisions to the past two unemployment reports:
The change in total nonfarm payroll employment for June was revised from -221,000 to -175,000, and the change for July was revised from -131,000 to -54,000.
Subject Meta:
Forum Categories:
| Attachment | Size |
|---|---|
| 249.04 KB |
sorry this is late folks
By now, there are plenty of other analysis on the report, although most don't get the graphs to this extent.
I happen to be sick so any eye-candy & numbers people I hope you're paying attention and will leave a comment.
why we need sites like The Economic Popullist
If you go to Google news or any major financial press, you'll see claims this unemployment report implies there is no double dip and some even call it good news.
That is unbelievable spin and why I note the civilian population growth numbers, participation rate, to show as more people are in the U.S. needing a job, there is not even enough job creation to even keep up with workforce population growth, never mind get the millions back to work.
I mean this is a terrible report, like the rest of them. We get headlines from the major financial press that literally deny the statistics, which is why I like to go over these government reports with a fine tooth comb.
I'm not using any tricks. Those are graphs from the St. Louis Federal Reserve. All of this shows, this is not a good report and that is from the report statistics themselves.
The Truth
Truth can be a scarce commodity where money talks -- thanks, Bob, for this forum and access to facts. The WSJ agenda/ Republicon-Democrat Coalition of the Corrupt has created unbelievable public cynicim and alienation. Yes, if we had a political party, I'd join and contribute.
Frank T.
Excellent analysis...
...and I agree we absolutely NEED websites like The Economic Populist...heck we need a political party like The Economic Populist, then I would actually believe there was hope.
Regards,
thanks
I try to hit all of the points in one article so it's all in one piece. Seems others write one aspect, then put into another article, another point and so on.
But bottom line, "Wall Street" thinking this report is great, well, my, my their golden goblets must have poisoned their brain.
Welcome to EP! If you want a post on the front page, on the left hand corner is an arrow, click the "up" and that moves articles to the front page, it's user generated.
Unemployment
Unemployment is a structural problem not a cyclical problem. Leadership is spending on Government programs that do not create wealth. Capital flows is to deficit spending instead of wealth creating private sectors. As long as taxes are increased, Federal Government deficits, and higher pricing then the consumer purchasing power is still shrinking. That means less jobs and a continued degradation of the job picture. New leadership that looks at capital allocation differently and protections to middle income wealth will bring an end to high unemployment.
If Leadership can not change their thinking, then we can only change the leaders.
We don't have a trillion-dollar debt because we haven't taxed enough; we have a trillion-dollar debt because we spend too much”
-Ronald Reagan quote
“The problem is not that people are taxed too little, the problem is that government spends too much.”
-Ronald Reagan quotes