
ADP, released their proprietary private payrolls jobs report. This month ADP is reporting a gain of 170,000 private sector jobs in January. December 2011 was revised down from 325,000 to 292,000. In contrast, the BLS reported 212,000 private sector jobs for December 2011. Graphed elow are the reported private sector jobs from ADP. This report does not include government, or public jobs.

ADP's numbers claim the service sector created 152,000 jobs while the goods sector gained 18,000 jobs. Manufacturing increased by +10,000 jobs for the month, better than nothing. ADP last month had a 22,000 increase in manufacturing jobs. ADP's financial services jobs increased by 9,000 jobs, and is the largest gain in two years. This report, if it matches Friday's official unemployment report, would overall imply another trending water type of job growth for we know there will be more government job declines and we need at least 80,000 jobs created each month just to keep up with population growth.
Construction gained 2,000 jobs for January 2012, but according to ADP, construction gained 27,000 jobs in December and was the most new jobs since November 2006.
ADP captures jobs by business size and this is worth looking at, especially due to it's relativity within the same report (and methods). In January:
Employment on large payrolls—those with 500 or more workers—increased 3,000, and employment on medium payrolls—those with 50 to 499 workers—rose 72,000 in January. Employment on small payrolls—those with up to 49 workers—rose 95,000 that same period. Of the 95,000 jobs created by small businesses, 11,000 jobs were created by the goods-producing sector and 84,000 jobs were created by the service-producing sector.
Below is the graph of ADP private sector job creation breakdown of large businesses (bright red), median business (blue) and small business (dark red). For large business jobs, the scale is on the right of the graph. Medium and Small businesses scale is on the left.
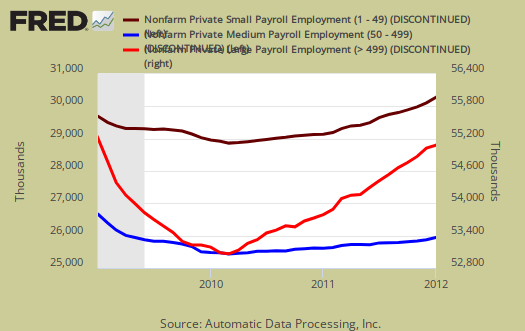
This is the same result, month after month. While this month is finally an improvement, generally, large business, who lobby Congress for their bad trade deals, more offshore outsourcing through foreign guest worker importation and labor arbitrage, are almost absent from job creation in terms of hiring Americans. Notice how large businesses have been declining and the pattern starts just about the time offshore outsourcing and the China PNTR came into effect in the above graph. Small businesses, on the other hand, have increased employment. May I suggest that small businesses are not international, they are not signing offshore outsourcing contracts and moving jobs to India and China. Multinationals, on the other hand, the below decade trend line clearly shows these so called U.S. corporations have abandoned the U.S. worker, on whole.
There is a historic strong mismatch between ADP and the BLS jobs report, although recently the two are converging again recently. To date, the number of private nonfarm payroll jobs ADP reports versus what the BLS reports and on a month-to-month and even cumulative basis do not match. This monthly error is often large, especially when looking at small job growth overall (< 400,000 jobs per month) on a month to month basis. The monthly reported BLS jobs is often within their survey 100,000 payrolls margin of error.
Below is the cumulative difference between what the ADP reports as the private nonfarm payroll jobs vs. the BLS (ADP minus BLS). This line shows the divergence, over time in number of nonfarm private payroll jobs reported between the two reports. The difference seems to be stabilizing around 400,000. This article will be updated with the January BLS payrolls data, released on Friday.
While ADP notes a simple correlation of 0.95, well, a 5% error between monthly reported jobs numbers is an average, and we can see on some months the differences are quite large and around 2008, the difference started to hit about 900,000 jobs. That said, the reported job growth is so piss pour, statistically we're rolling around in the margin of error each month.
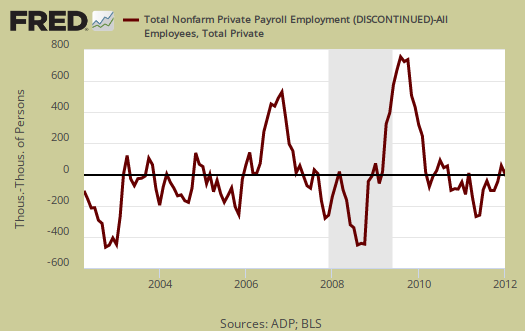
ADP does use the same seasonal adjustment as the BLS, but their other methodology and even sampling size are different, proprietary. That said, ADP has now put up some details of their methodology to explain the statistical differences between their estimate, the actual mathematics, vs. the BLS. This is new, and good ADP is disclosing their entire methodology so we may get more apples to apples comparisons of the two reports. The graph below is the monthly change of private jobs as reported by ADP.

Regardless of the statistical differences between ADP and the BLS, this indicates a return to mediocre job growth potentially. Not something a nation with an estimated 28 million people needing a job wish to see.
Here is the December 2011 ADP private sector jobs report overview, only graphs revised.
December was an adjustment issues month for ADP additionally (see cumulative by month error graph).
crappy low paying service jobs and small business
It appears most of the job growth was in crappy service types of jobs and this generally has been the overall job growth. We've replaced our middle class income jobs with burger flipper, retail sales and leisure and hospitality.
We're going to go in depth on what types of jobs are being created after the January BLS payrolls report is released.