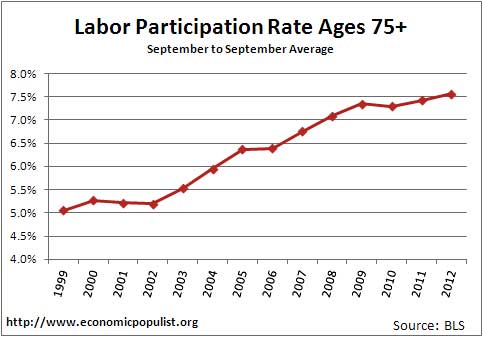
Many have heard various economic factions claim the employment situation is improving, that the drop in the unemployment rate is not due to millions no longer being counted in the statistics. These same groups will claim the aging population is throwing off the labor participation rates due to the large number of people retiring, that the record low labor participation rates are a fluke. They claim the flood of retiring baby boomers distort the statistics. Yet a quick look at the data shows this is not the case. We graph labor participation rates by age bracket to show more people as a percentage, 65 years and over, are working in their golden years than ever before.

The thing is, labor participation rates are available from the BLS website by age bracket and these figures reflect the age of the CPS survey participant and the population size of that age bracket group when the monthly Household survey was taken. The labor participate rate is defined as the ratio of the civilian labor force to the civilian noninstitutional population. This is a ratio, a fraction if you will, a percentage of those participating in the labor market against the overall population. Even if the baby boomers increase dramatically the size of America's retired, by looking at labor participation rates via such small age groupings, there are no population distortions by an aging America.
The civilian labor force is made up by those who are employed and those who are officially looking for work. By breaking down the labor participation rate by age bracket, we see there are not more retirees as a ratio for those over 65, in fact a larger percentage of people over the age of 65 are actively participating in the labor force than ever. Each labor participation rate by age group is the civilian labor force divided by the noninstitutional civilian population for that age bracket at that moment in time.
There is one small problem in that labor participation by these age statistics are not seasonally adjusted. Yet, one can obtain a clearer picture by taking the annual labor participation rate average and thus remove seasonality, those wild statistical monthly fluctuations which come from summer jobs and winter snow birds.
We did one better and took the annual moving average of labor participation rates per age bracket in order to get an up to date picture on where these rates are currently. We take the annual average from October to September, just so we have the most recent statistics in our results. Below are the graphs, at the highest resolution available publicly for labor participation by age bracket.
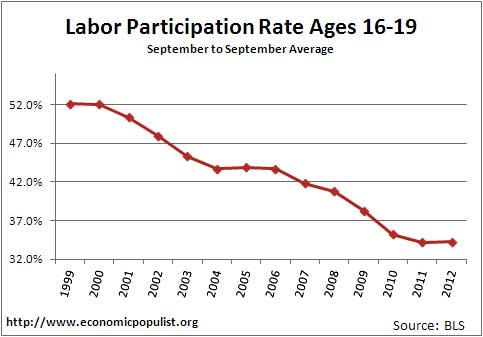
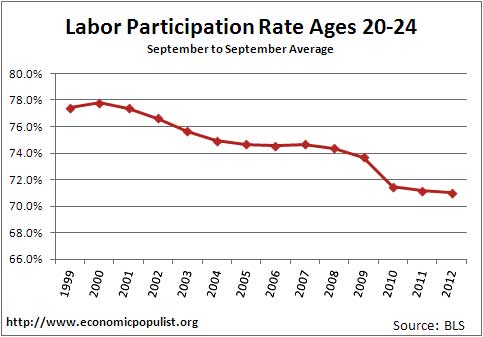
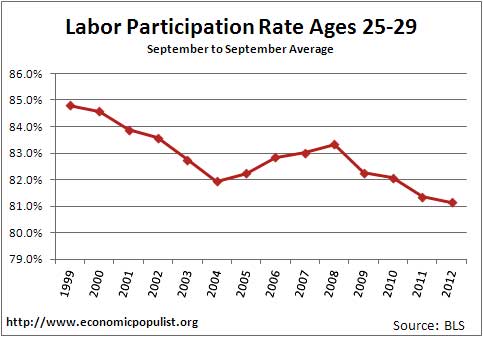
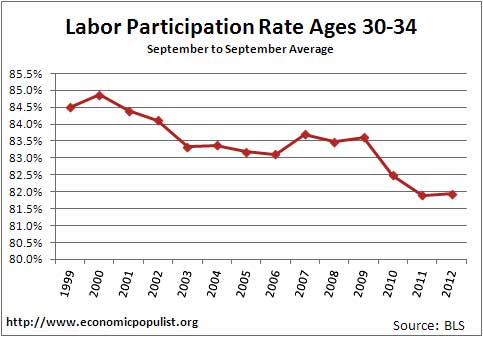
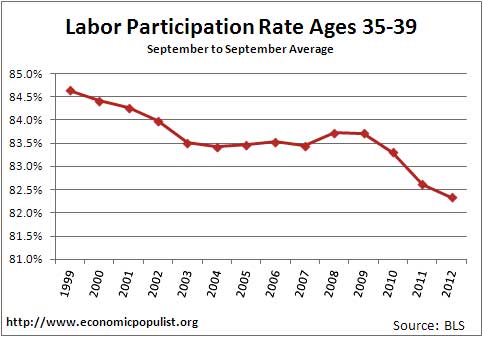
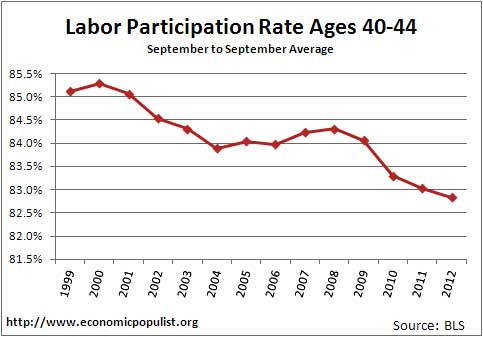
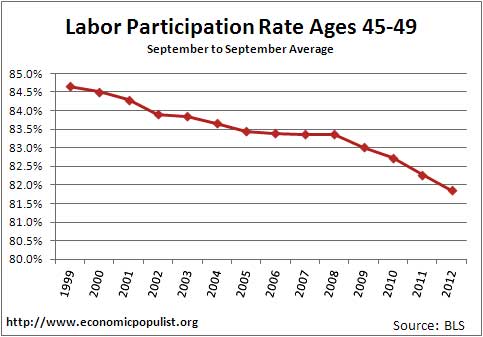
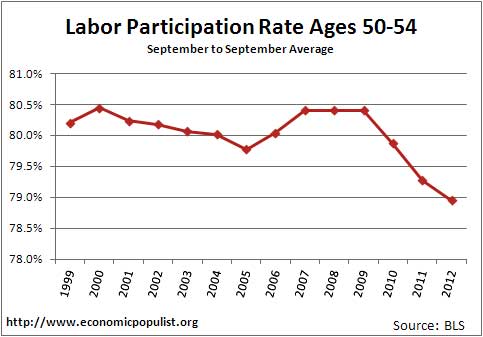
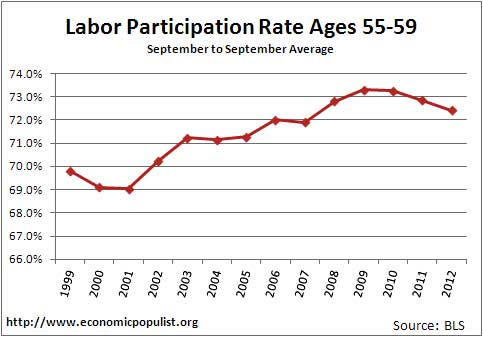
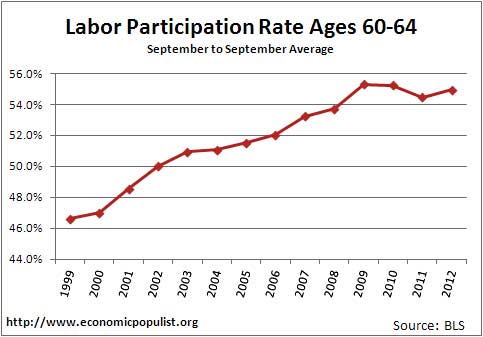
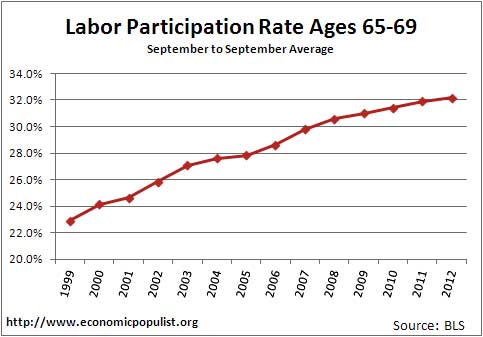
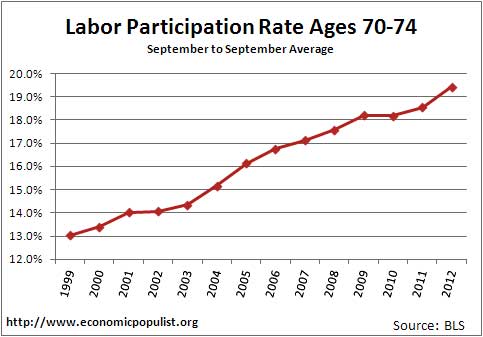
The most important thing the above graph-o-rama shows is, no Virginia, baby boomers are not the cause of the record low labor participation rates. Labor participation rates dropped dramatically for people in their prime working years and thus there really is a large segment of the population that probably needs a job that are not being counted as unemployed. One sees drops in those between the ages of 25-54. Expanding further to the real working years, ages 18-65, we also see drops in labor participate rates .
We can see a host of fallacies blown away quite easily by the above breakdowns More people as a ratio are working in these so called retirement years than before the recession. We also see the death of work for those ages 16 to 19 to the point it's almost shocking. Who doesn't remember that summer part-time job as a teenager? What happened? Were teenagers labor arbitraged and displaced by foreign guest workers and illegal workers? Why did the labor participation rates drop so dramatically and where, pray tell, will they get their first on the job experience from now?
The real question is why aren't all of these factions claiming things are improving, all is well, also not digging out BLS data and creating valid graph-o-ramas such as the above? Beyond the time sink of creating graphical images and calculating partial averages in spreadsheets, we can't think of a damn good reason these same people are not.

Because they rely on lies and crimes? The truth impedes that
Why would professional liars and criminals in the government and private business do anything that would impede their quest for more power and financial gain, often only attainable at the expense of others and the truth? Come on, propaganda and lies and barriers to entry (e.g.,, nepotism and cronyism ensure no one that might be too honest or too bright gets into the private party to spoil the fun) are there for a reason. There's a reason the common man and woman aren't sitting in on job plan discussions with lobbyists, on private jets with CNBC's Bartiromo and Citi execs, in IMF meetings, at DC lunches, CEO salary discussions (compare the truth re: Vikram Pandit's compensation vs. the true state of overqualified and unemployed Americans - overqualified go homeless while idiot banksters get richer for nothing). Truth, what the Hell is that? This is 2012, truth is what the 1% and their puppets in the media and government tell us it is, and if someone's unwilling to accept that because "green shoots" and benevolent CEOs aren't paying the average person's winter heating bills, then they can simply be ignored and disappear from any labor pool anywhere. Gone. Remember all those angry unemployed Greeks that wanted to meet and greet Merkel? The police kept them away and made them temporarily disappear so Merkel could enjoy a nice stroll without getting teargassed or meeting those great unwashed massed. Gone. Just like that. So whether it's stats or actual police force, nothing is above these folks to make us disappear.
the people I refer to are not lobbyists
More economists and others who do pour over these statistics the same as we do. I've been reading the claim the low labor participation rates are due to aging population for some time and it does take awhile to crunch these numbers, believe me, that's a lot of graphs and data series breakdown to do the above using just Excel.
But these people can easily obtain quickly the labor participation rates of those between the ages of 25-54, monthly and seasonally adjusted. It's fallen roughly two full percentage points from before the Great Recession and when dealing with ratios of large numbers that's significant.
I might do this exercise again using civilian populations and employment ratios, with the same tight 5 year age window to show similar results.
Pundits, lobbyists seem to make up numbers as they go along.
Excellent data
Thanks for the excellent data analysis, Robert.
Participation rates or employment-population rates are my go-to for judging the economy, since the headline unemployment number deliberately undercounts millions.
It should be COMMON SENSE that the 2008 cliff-dive in employment-population was not caused by gradual changes in demographics.
It should be COMMON SENSE that boomers who saw their retirement savings take a hit in the 2001 and 2008 recessions did not win the lottery and retire early. To the contrary, they're working longer to make up for inadequate retiremnent funding, as your charts illustrate.
glad it is appreciated!
I should say the reason I went with the annual averages is smoothing. I did not want to run seasonal adjustments for there are unique elements to those adjustments per subject and in this case it appears by age as well.
The goal was to remove as much seasonality as possible to show the real trend.
Employment is amazingly seasonal and different age groups have different levels of seasonality. This is scary actually since to survive we need full time, full year round jobs.
Ages 16-19 are extremely seasonal and reflected in labor participation rates.
After I ran these numbers I was actually surprised at the labor participation rates of those over age 65. I think that's a combination of the new reality "work till you drop" and also people are simply more healthy, more able bodied these days and are perfectly capable of working this long.
Interesting
It looks like many retirement age or near retirement age are forgoing retirement or re-entering the job market. This is bad for the younger workers because one experienced retiree leaving pays for two or three new people to enter the market.
Also interesting is the almost universal 85% participation rate in '99. What is so different (besides dot-com bubble, housing bubble) between '12 and '99?
older workers not pushing out younger workers
Older workers are not pushing out younger workers, that is false and goes along with institutionalized age discrimination. There was just a study released showing this is not so. Here an article with links to the actual study.
You are also ignoring something called experience and training that the older worker probably has but bottom line, these age groups are not substitutes of each other.
Worker substitution is an interesting topic. It seems to go with attitudes. In other words, some will claim older workers are perfect substitutes for younger ones, yet, magically foreign workers are not substitutes for native workers.
By occupational categories, even unskilled labor, it's questionable that younger workers are substitutes for older workers. Older workers, even in unskilled jobs, tend to gravitate towards office, retail sales, sorts of positions which require less manual labor, or reasonable manual labor. Teenagers often look for part-time, summer jobs. It looks more suspect that teenagers have been displaced by foreign workers than anything else. Case in point, some of the occupations listed for H-2B Visas are traditional teenager summer jobs. There is a claim of a shortage in lifeguards, waitresses, waiters, cleaning staff, summer resort staff, fast food workers and hence employers claim they need foreign guest workers Visas to bring in workers (H-2B). That isn't even touching upon illegal workers who also can be found heavily in landscaping, construction summer jobs, restaurants, cleaning crews which also are commonly summer as well as part-time jobs.
In 2000, the China PNTR came into play as well as telecommunications, Internet became cheap enough they could offshore outsource jobs. So, two things happened, well, three, they offshore outsourced jobs, foreign guest worker visas were increased and the China trade agreement is so poorly written it encouraged goods manufacturers to move to China in droves and it was almost impossible to compete at that time if they did not. So, it is also possible that career workers, ages 25-65, who normally would be in more semi-skilled, or skilled manufacturing types of jobs were forced back into the lower paying retail trade sorts of jobs. This would be all age groups as worker substitution for those between the ages of 16-19, 20-25, not those over the ages of 65.
Media now says initial claims under 400,000 are a good sign?!
Given this week's 388,000 initial unemployment claims, the media now says, "[m]any economists believe a reading below 400,000 points to an improving labor market." That's from Reuters on 10/18/12. Really?! So if 399,000 people continue to get laid off for the next 1-50 years, all is well in the USA? Come on man, just simple logic. It's 2012, companies still hacking payrolls by 300,000+ and sending every job not nailed down overseas or replacing it with someone new to our shores (but more labor arbitrage, more, more more), or making people reapply to their own jobs and then hiring them back at a discounted wage or as interns for free. But hey, economists and the media keep upping the ante, so the number used to be under 300,000, then mid-300s, now it's anything under 400,000 and all is well. Watch next week when this number is inevitably increased up from 388,000, I'm guessing just under 400,000 because almost all other revisions are up and must be kept under 400,000 because that's "improvement" in the labor market. If it can't be kept under 400,000, look for the new "improvement" number in the labor market to be upped to 425,000. Yes, they are this obvious about changing the measurements and signs of improvement and deterioration. So blatant, it's sad that people get paid for this crap while 27 million other people are left out in the cold like Dickensian street children staring at liars and manipulators enjoying a warm meal next to a fireplace.
Here's the 350,000 (now 400,000) Reuters was using last year
From an August 11, 2011 story on NPR, Reuters reports:
Economists polled by Reuters had forecast claims steady at 400,000. The prior week's figure was revised up to 402,000 from the previously reported 400,000.
...
The four-week moving average of claims, considered a better measure of labor market trends, slipped 3,250 to 405,000. Economists say both initial claims and the four-week average need to drop close to 350,000 to signal a sustainable improvement in the labor market.
http://www.npr.org/blogs/thetwo-way/2011/08/11/139524874/new-unemploymen...
Just over one year later and the new number of claims required to show improvement, with fewer people actually working, has moved up? Madness.
you're commenting under the wrong post for initial claims
Need to be here. I don't want to write another initial claims but I'll put updates in the comments,
initial claims below 400k is "good"
We did this correlation already, see here and here.
First, always go off of the four week moving average and Reuters is wrong, it's not initial claims below 400k, it's the four week moving average below 400k and that doesn't mean payrolls growth, it means hemorrhaging stopped, we're keeping up with population growth, breaking even such as the new terrible conditions require.
For job growth we need the four week average below 360k.
See the two links, there is a nice graph created showing the change in payrolls against the four week moving average.
Yeah, I know the financial press often pulls numbers out of their ass. These financial reporters do not calculate out from first principles, they simply ask someone else and then print that. At least that's my theory and why we get echo chambers that do not match the actual statistics.
Thank God for the St. Louis FRED system since they make instant eye candy so easy, we can now digest these statistics and get the general public to follow instead of reading these "articles" we see that are way too often wrong.