
The Federal Reserve Industrial Production & Capacity Utilization report shows industrial production gained 0.2% in January. There were also revisions back to August with all but one month revised downward. December was revised to a -0.3% decline and November's blow out was toned down to 1.1% growth increase. Manufacturing alone grew by 0.2% and utilities jumped up 2.3% in January on weather. Mining, which includes oil, decreased by -1.0%. The drop in oil prices is clearly having an impact on oil production in the United States, yet in December mining overall jumped up by 2.1%. The G.17 industrial production statistical release is also known as output for factories and mines. Industrial

Total industrial production has now increased 4.8% from a year ago after the new revisions. Currently industrial production is 6.2 percentage points above the 2007 average. Below is graph of overall industrial production's percent change from a year ago.

Here are the major industry groups industrial production percentage changes from a year ago.
- Manufacturing: +5.6%
- Mining: +8.5%
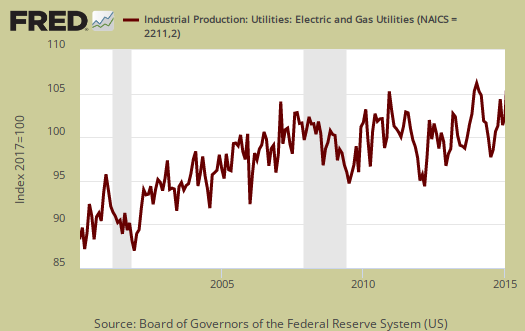
- Utilities: -6.6%
Manufacturing output is 2.1 percentage points it's peak 2007 Level. Motor vehicles and parts dropped -0.6%, while vehicles by themselves dropping -1.5%. Computers and parts increased 1.2% for the month.
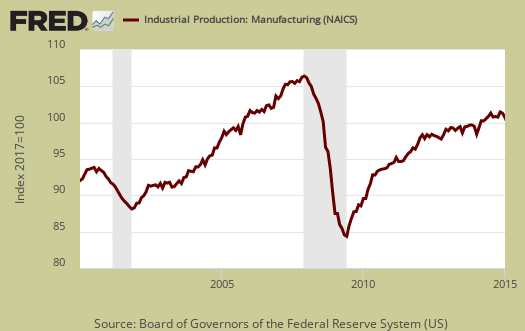
Within manufacturing, durable goods increased 0.4% for the month. Primary metals increased 1.7% for the month.

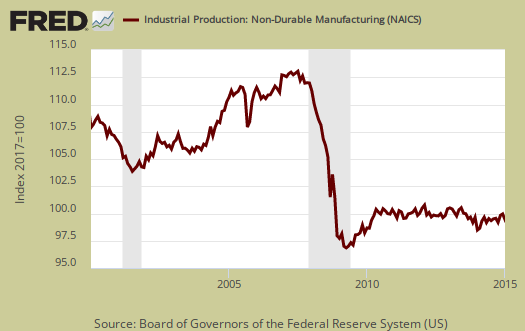
Nondurable goods manufacturing had no growth for the month. The reason is not just petroleum and coal, which dropped -0.7%, but printing, which dropped -0.4%.
Mining showed a -1.0% monthly decrease. Mining includes gas and electricity production and the Fed have a special aggregate index for oil and gas well drilling. In January this index dropped a whopping -10.0% and for the year is down -5.0%.

Utilities are volatile due to weather and why the below graph shows the wild swings. Track the polar vortexes and heat waves in the below graph.
There are two reporting methodologies in the industrial production statistical release, market groups and industry groups. Market groups is output bundled together by market categories, such as business equipment or consumer goods and shown below:
Among the major market groups, the indexes for consumer goods, business equipment, business supplies, and materials all registered gains in January, while losses were recorded by construction supplies and by defense and space equipment. The index for consumer goods moved up 0.2 percent as a result of a gain of 2.3 percent for consumer energy products; the output of durable consumer goods decreased 1.0 percent, and the production of non-energy nondurables was unchanged. The output of business equipment increased 0.8 percent, with increases of about 1 percent in the indexes for information processing equipment and for industrial and other equipment. The index for materials rose 0.2 percent, with broad-based gains among durable and nondurable materials partly offset by a small decrease in the output of energy materials.
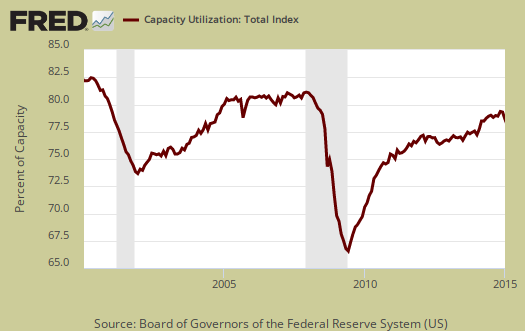
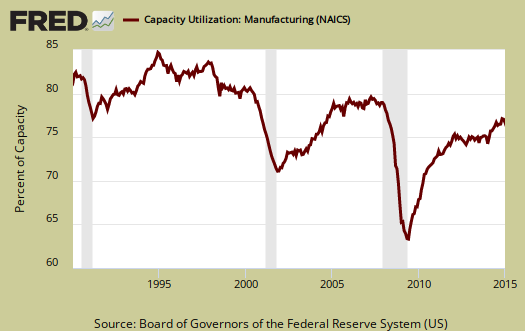
Capacity utilization, or of raw capacity, how much is being used, for total industry is 79.4%, unchanged from last month. . Capacity utilization has increased 0.7 percentage points from a year ago. Manufacturing capacity utilization is 78.1% and is 2.6 percentage points higher than a year ago. Mining capacity utilization is 87.5% and is down -0.4 percentage points from a year ago. Utilities use of it's capacity is 78.2% and has dropped by -6.3 percentage points from a year ago. Manufacturing capacity is still -0.5 points below the long term average (1972-2013).
Capacity utilization is how much can we make vs. how much are we currently using, of what capacity is available now, or output rate. Capacity utilization is also called the operating rate. Capacity utilization is industrial production divided by raw capacity.
Capacity growth is raw capacity and not to be confused what what is being utilized. Instead, this is the actual growth or potential to produce. Capacity is the overall level of plants, production facilities, and ability to make stuff, that we currently have in the United States. Capacity growth overall has increased 3.1 percentage points from a year ago. Below is the capacity growth increase from a year ago of the subcategories which make up industrial production.
- Manufacturing: +2.1%
- Mining: +9.0%
- Utilities: +1.0%
Below is the Manufacturing capacity utilization graph, normalized to 2007 raw capacity levels, going back to the 1990's. Here is where offshore outsourcing really shows up. Pay particular attention to the 2001-2003 as manufacturing had a mass exodus to China after passage of the bad trade deal in 2000.
Overall there are some warning signs here that the economy is not quite so humming as it out to be. Another sign is the collapse of oil demand.
Here are our previous overviews, only graphs revised. The Federal Reserve releases detailed tables for more data, metrics not mentioned in this overview.
Not a spelling Nazi
Title should exchange "Industiral" for "Industrial". This stuff is too important to be discounted, out of hand, because of a transposal.
Thanks for that, it is corrected
No spell checking in the titling I agree, bad form.