
Business Inventories, or Manufacturing and Trade Sales and Inventories, show a -0.1% decrease in sales and an +0.3% increase in inventories for May 2012. Inventories for Merchant wholesalers increased +0.3%, manufacturers' inventories declined -0.2% and retailer's inventories increased +1.0%.
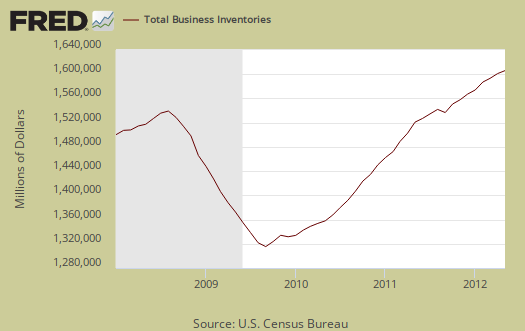
Below is the monthly percent change for business inventories.

This report includes:
The data that is used as input for the Manufacturing and Trade Inventories and Sales (MTIS) economic indicator release is collected by three separate surveys: the Manufacturers' Shipments, Inventories and Orders Survey (M3), the Monthly Wholesale Trade Survey (MWTS), and the Monthly Retail Trade Survey (MRTS).
Another bad sign, although it's slight, is inventories grew faster than sales for May 2012. If inventories accumulate, and sales are declining, that's not good news for economic growth and even worse news potentially down the road as businesses try to shed their excess inventories by any means possible. Below is the sales to inventories ratio, now 1.27 and the same as May 2011. Notice this ratio increases before and during recessions.

This Census economic report covers Retail, Manufacturing and Wholesale inventories, which is pretty much most of the non-farm inventories the BEA uses for their change in private inventory calculations in the GDP report and national accounts. There are a host of adjustments, including inventory valuation that the BEA does to changes in private inventories for national accounts. NIPA is the big, gigantic "ledger" of the national books and from where GDP is calculated.
The change in non-farm private inventories contributed +0.10 percentage points of the 1.9% Q1 GDP , annualized, quarterly in real 2005 dollars.
The change for Q1 nonfarm private inventories, nominal, was $72.0 billion, as listed in the GDP report. From just this business inventories report, in nominal amounts, not annualized and not adjusted for valuations, we get a $77.3 billion change in Q1 business inventories.
Assuming another +0.3% increase for June's business inventories, we get a $45.1 billion change in business inventories for Q2.
What does this imply? That the Q2 GDP contribution for changes in private inventories will be less than Q1. In other words, do not except to see changes in private inventories save the day, or be significant for Q2 2012 GDP.
Another way to look at this is the nominal, annualized percentage change in business inventories for Q1 is 6.9%. Using the same +0.3% monthly increase to estimate June's business inventories, we get an annualized quarterly change of 3.9%, or half the change that Q4/Q1 showed.
At this point, if I had to place bets on Q2 GDP, I'd say we're looking at a growth rate of less than 1%, or hovering around 1%.
Q2 GDP growth rates slashed
This Marketwatch article shows various estimates for Q2 GDP growth were slashed.
Estimates vary from +0.6% to +1.3% Q2 GDP.
I lean a little higher, but only for the advance report and this is the reason. Trade data is always significantly revised from the advance GDP to other revisions, due to data lag and IMHO, the estimates used for the advance GDP report are usually too optimistic.
All said and done, I feel confident, looking at the various partial estimates on this site for Q2 GDP contributions, we're looking at a Q2 GDP as stated above.