
The S&P Case Shiller home price index shows a -4.1% decline from a year ago over 20 metropolitan housing markets and a -3.7% decline for the top 10 housing markets from July 2010.
Below is the yearly percent change in the composite-10 and composite-20 Case-Shiller Indices. These are not seasonally adjusted, but comparing from July 2010. As you can see, there is clearly was a new decline going on for 2011, although the last two months, the rate of that early decline has slowed.

Wondering why we have conflicting news headlines on the S&P Case-Shiller Housing Index? Because some in the press use the seasonally adjusted data and others do not. To make matters worse, some compare the not seasonally adjusted monthly results and others the housing price index in comparison to one year ago. For example, the not seasonally adjusted change for the composite-20 was 0.9% from June to July. The Seasonally adjusted composite-20 percentage change was zero. Same situation for the composite-10 index. The not seasonally adjusted composite-10 increased 0.9% from June to July, but seasonally adjusted? That was -0.1% no change and was also zero from May to June.

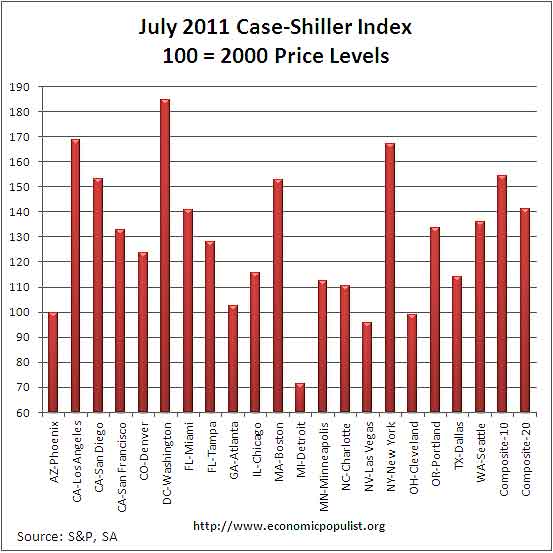
The above graph shows the composite-10 and composite-20 city home prices indexes, seasonally adjusted. Prices are normalized to the year 2000. The index value of 150 means single family housing prices have appreciated, or increased 50% since 2000 in that particular region. These indices are not adjusted for inflation. The composite-20 index, seasonally adjusted is 141.01 and comparable to June 2003 levels (ignoring 2009). Not seasonally adjusted the composite-20 index is 142.77, which also is slightly above June 2003 levels.
The Case-Shiller report even spells out the not-seasonally adjusted data is simply due to it being summer, the housing season.
This is still a seasonal period of stronger demand for houses, so monthly price increases are expected and were seen in 17 of the 20 cities. The exceptions were Las Vegas and Phoenix where prices fell, while Denver was flat.
The S&P/Case-Shiller Home Price Indices are calculated monthly using a three-month moving average and published with a two month lag. Their seasonal adjustment calculation is the standard used for all seasonal adjustments, the X-12 ARIMA, maintained by the Census.
So, why would S&P report the not seasonally adjusted data, when we all know spring is the start of house buying and building season? According to their paper on seasonal adjustments, they claim the not seasonally adjusted indices are more accurate. Why? It appears the housing bubble and bust has screwed up the cyclical seasonal pattern. What a surprise.
The turmoil in the housing market in the last few years has generated unusual movements that are easily mistaken for shifts in the normal seasonal patterns, resulting in larger seasonal adjustments and misleading results.
Not seasonally adjusted data creates more headline buzz. S&P does make it clear that data should be compared to a year ago, to remove seasonal patterns, yet claims monthly percentage changes should use not seasonally adjusted indices and data. This seems invalid for housing markets are highly seasonal. Below are the seasonally adjusted indices for July 2011.
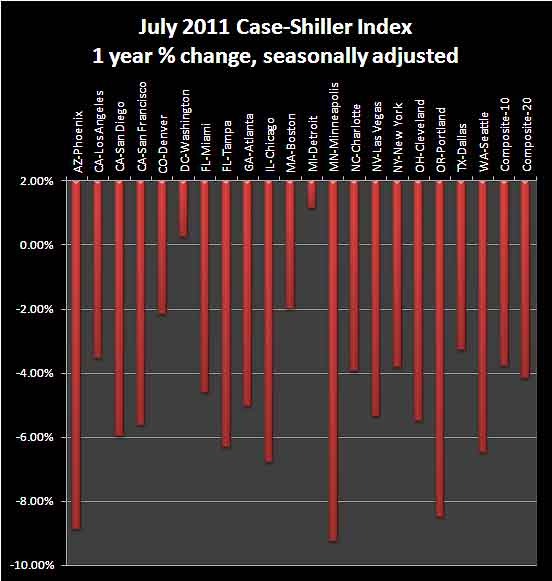
For July 2011, the S&P/Case-Shiller Home Price indexes shows 18 of the 20 cities tracked are down for the year. Detroit, finally increased.
Below are all of the composite-20 index cities yearly price percentage change, using the seasonally adjusted data.
Calculated Risk, has additional custom graphs and data analysis and is the uber site for residential housing, with valid statistical analysis.
Repossessions (read evictions), on foreclosures hit a 6 month low, but foreclosures are on the rise:
US foreclosure filings rose by 7% in August and default notices increased more than 40% in several states, with just five states accounting for more than half of the total.
Default notices on a total of 78,880 properties were filed for the first time in August across the country, a nine-month high and a 33% increase from July, the biggest month-on-month rise since August 2007. However, despite the strong rise on the July figures, default notices were still down 18% from August 2010 and 44% below the monthly peak of 142,064 default notices in April 2009.
There were also 228,098 foreclosure filings − default notices, scheduled auctions and bank repossessions − reported in the month, according to the latest data from RealtyTrac. This equates to one in every 570 US housing units filing for foreclosure that month.
Corelogic reported shadow inventory or houses being kept of the market, shrank to 1.6 million from 1.9 million.
S&P does a great job of making the Case-Shiller data and details available for further information and analysis on their website.
Bloomberg cranked some more statistics to show 3 month averages, annualized for both the not seasonally adjusted and seasonally adjusted city data.
Here is last month's overview of the Case-Shiller report.
AAA+++ review and report
Thanks.
BTW: Sooooooo tempting in the first graph shown (top of page) to tweak that last little apparent low so as to go back up and then maybe oscillate around 0% change -- meaning that the long sought 'low' has been established. That would then eliminate that factor of buyers waiting for the low.
But, is that what the graph will look like a year from now (oscillating around 0% change)? -- considering all the foreclosures that are said to be coming soon or already in the works? I don't know. It's possible.