
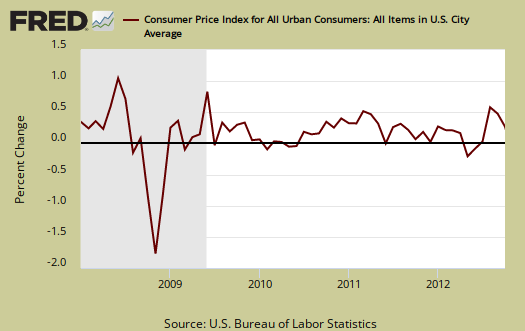
The October Consumer Price Index increased 0.1% from September. CPI measures inflation, or price increases. This month the culprit isn't gas prices, the gasoline index declined by -0.6% after July through September's meteoric 16.6% rise. The problem is the cost to rent a place to live increased 0.4% and had the highest monthly jump since June 2008. The shelter index overall went up by 0.3% and was over 50% of the cause for CPI's October 0.1% monthly increase. Below are CPI's monthly percentage changes.
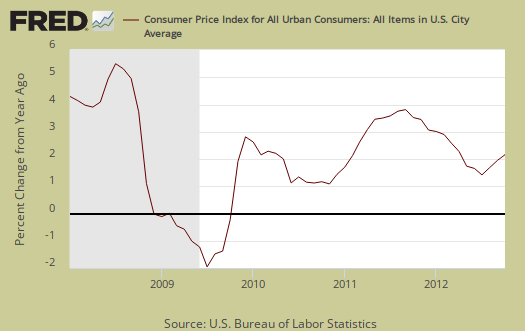
CPI is up 2.2% from a year ago and the highest increase since April 2012, as shown in the below graph.
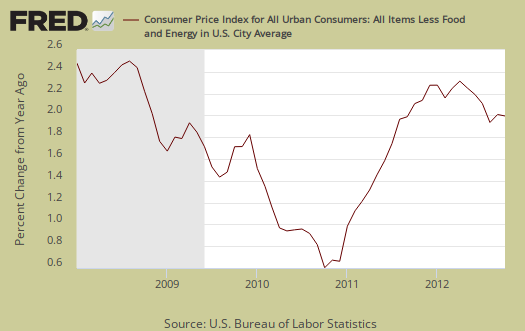
Core inflation, or CPI minus food and energy items, increased 0.2% for October, after 0.1% increases for the previous three months. Core inflation has risen 2.0% for the last year. Core CPI is one of the Federal Reserve inflation watch numbers. These low figures probably helped justify more quantitative easing, which increases commodity prices.
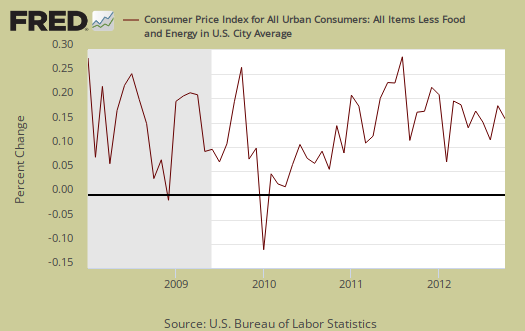
Core CPI's monthly percentage change is graphed below.
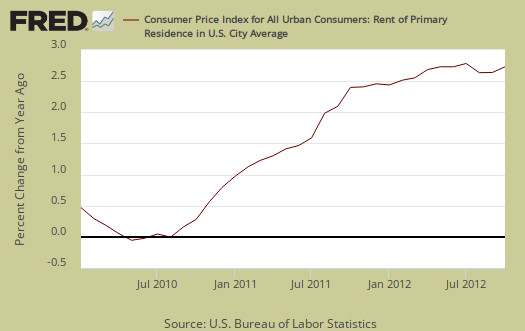
Shelter increased 0.3% and is up 2.3% for the year. The shelter index is comprised of rent, the equivalent cost of owning a home, hotels and motels. Rent increased 0.4% and the cost of renting has increased 2.8% for the last 12 months. This is the highest month rent increase since June 2008. Airfares rose 2.4%, a reflection of increasing fuel costs, but are still down -0.5% from a year ago. Used cars & trucks declined -0.9%, while new autos decreased -0.1% for October. Used cars & trucks prices have declined -2.1% from a year ago. Hotels & Motel's' increased 0.5%. College tuition, another soaring cost, increased 0.7% and is up 4.4% for the year. Graphed below is the percentage change from a year ago of rent, the largest monthly household expense for people who can least afford increases as those with less money disproportionately rent vs. own.
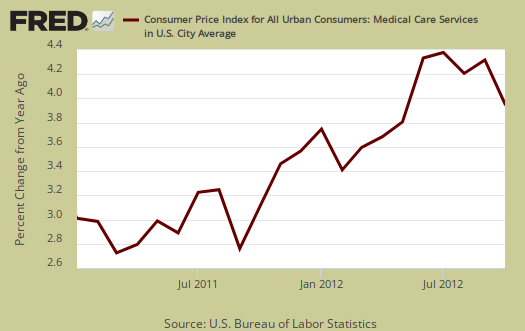
Another cost which never drops is medical care. Medical care services increased 0.3% and has increased 3.9% over the last 12 months. Hospital services increased 0.1% in a month and have increased 4.5% for the year. Prescription drugs increased another 0.2% and are up 3.6% for the year. Below is a bar graph of the medical services index. Nowhere else do we see a ridiculous, constant increase in costs.
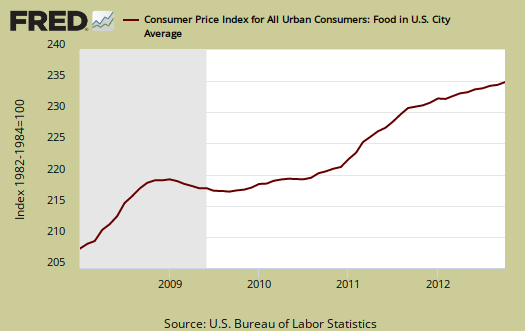
Food and beverages overall increased 0.2% for October and are up 1.7% from a year ago. The food at home index (think groceries) increased 0.3% for the month and is up 1.0% for the year. Dairy increased 0.8% for the month and has three months of price increases, yet is claimed to be down -1.1% for the last 12 months.
Meats, poultry, fish, and eggs increased 0.8%, now up 2.2% for the year and fruits and vegetables increased 0.6% for the month, down -0.1% for the year.
Eating out, or food away from home increased 0.1% from last month and is up 2.7% from a year ago.
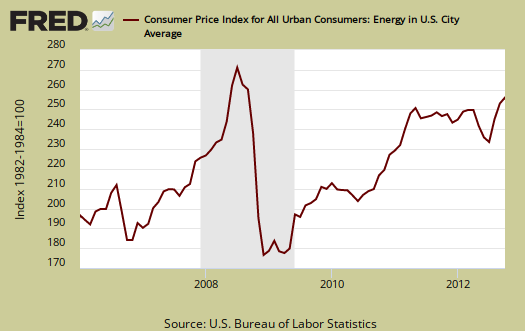
Energy overall decreased -0.2% for October, but is now up 4.0% for the last 12 months. The BLS separates out all energy costs and puts them together into one index. Energy costs are also mixed in with other indexes, such as heating oil for the housing index and gas for the transportation index. Fuel oil for the month increased 1.1% and natural gas decreased -0.2% for October. Below is the overall CPI energy index, or all things energy.
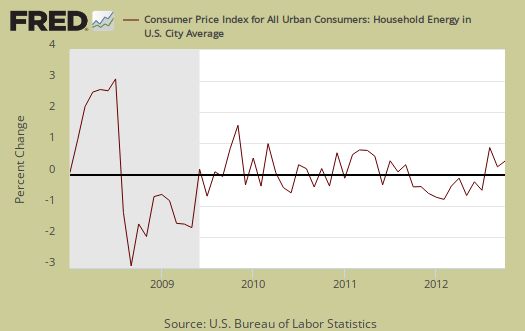
Graphed below is the household energy index which includes electricity and natural gas, shown by monthly percentage change. This month the index increased 0.4% and for the last 12 months has decreased by -2.8%. This is a different, special index to show the overall costs for energy into your home only, (unless you drive your car in your mansion or run generators for your tent).
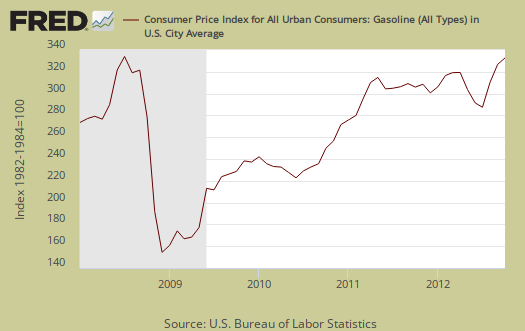
Graphed below is the CPI gasoline index, which declined -0.6% this month but has increased 9.1% for the year.
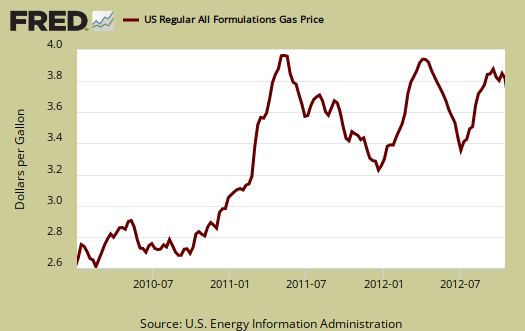
Below are gas prices, last updated November 12th. High oil prices have a strong correlation with recessions.
According to the BLS, for the year, food and beverages, which includes food at home, made up 15.2% of the index. Housing is 40.9% and transportation, including gas for the car, is 17.2% and all energy is 10%. Medical care is only 7.1%, they claim. All items minus food and energy are considered 75.8% of the total price expenditures for consumers.
The DOL/BLS does take yearly surveys on where the money goes in the monthly budget, but as one can see, food and energy are significant amounts of the monthly finances. Run away costs in these two areas can break the bank, so can food. Additionally CPI uses substitution, so if steak goes through the roof, somehow we're all just fine with hamburger and prices didn't really overall increase much. If we see food inflation flat over the next year, we know something is wrong with the measurement as the drought is projected to dramatically increase food prices.
CPI-W for the month, unadjusted was 227.974, a 2.2% increase for the year, and increased 0.1% for the month, although not seasonally adjusted. CPI-W is used to calculate government transfer payments, such as social security increases. The cost of living adjustment (COLA) for social security and other government payments will be 1.7% for 2013. This is a small increase and believe this or not, there is talk of stopping adjusting social security and other government payments for inflation as part of budget cuts, which is de facto cutting social security payments without admitting to doing so.
Last month's CPI report overview, unrevised, although most graphs are updated, is here.
If you're wondering why the graphs look weird, the graph calculates percentages from the index and doesn't round. The actual data from the BLS report does round to one decimal place. In other words, 0.05% is rounded to 0.1%.
Recent comments