
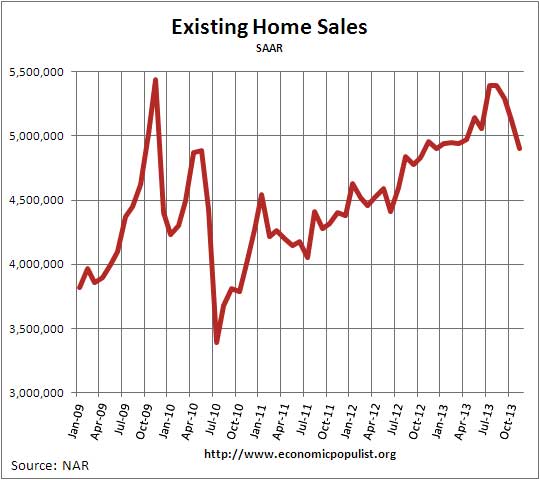
The NAR reported existing home sales plunged -4.3% from last month and are down -1.2% from last year. This is the first yearly decline in existing home sales since June 2011, a full 29 months ago. Unsold Inventory increased 5.0% from last year and represents a 5.1 months supply at current rates . Volume was an annualized and seasonally adjusted 4.90 million for November 2013.
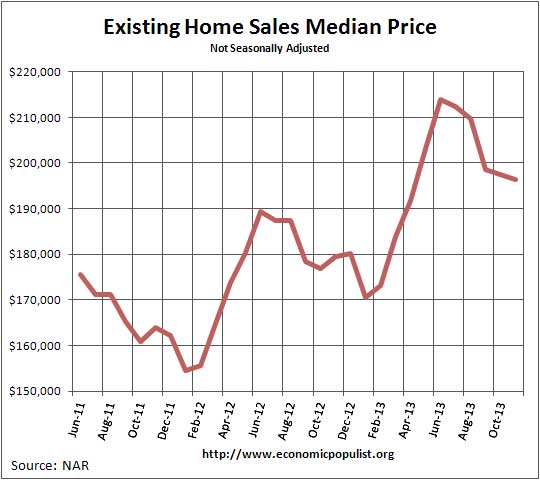
The national median existing home sales price, all types, is $196,300, a 9.4% increase from a year ago. Below is a graph of the median price. One needs to compare prices only a year ago for increases due to the monthly ups and downs in prices associated with the seasons. The recent plunge in the below graph might be seasonal in other words.
The average home price for November was $244,500, a 7.3% annual increase. The NAR went into denial mode again on the declining sales and blamed a low supply as the cause. They also claimed there is this amazing pent up demand for homes being squeezedby mortgage interest rates and low housing inventory. Wages and the fact most Americans cannot afford a home never enters the NAR dialog. They do mention price increases and claim rents have increased at the highest pace in five years and annual home price increases are at the fastest pace in eight years.
What is more interesting is the decline in distressed home sales. Foreclosures and short sales are now only 14% in November whereas a year ago they were 22% of all sales. The breakdown in distressed sales was 9% foreclosures and 5% short sales. Below is the discount obtained from these sales:
Foreclosures sold for an average discount of 17 percent below market value in November, while short sales were discounted 13 percent
So called investors are still buying up existing homes. All cash buyers were 32% of all sales. NAR reports individual investors purchased 19% of the existing homes and 7 out of 10 investors paid cash. First time home buyers were 28% of the sales.
The median time for a home to be on the market was 54 days. In November 2012 the median time an existing home was for sale was 70 days and this appears to be due to less short sales, which were on the market a full 120 days.
While NAR seems to be in denial about slowing sales and the large percentage of all cash sales, there is some things coming down the pike which should decrease sales further. From the NAR:
According to Freddie Mac, the national average commitment rate for a 30-year, conventional, fixed-rate mortgage rose to 4.26 percent in November from 4.19 percent in October; the rate was 3.35 percent in November 2012.
NAR President Steve Brown, co-owner of Irongate, Inc., Realtors® in Dayton, Ohio, noted that new rules defining the Qualified Mortgage will be going into effect soon. “New underwriting rules to protect borrowers, effective in January, will prohibit many loan features, set tighter limits on the amount of debt a borrower can have and still get a mortgage, and require that lenders accurately measure a borrower’s ability to repay,” he said.
“This means that qualified borrowers are getting a loan that they are very likely to be able to repay, but some borrowers may wind up paying much more for their mortgage, or not get a loan at all due to the tougher standards,” Brown said. “The new rules may tighten credit too much, but we’re hopeful regulators will make adjustments if this proves to be true.”
RealtyTrac showed November foreclosures are at the lowest level in five years and declined 32% from a year ago. This implies investors swooping up other people's homes might be running out of supply. Corelogic recently reported 6.4 million homeowners have underwater mortgages.
Below is NAR's breakdown by existing home sales type and regions.
Single-family home sales fell 3.8 percent to a seasonally adjusted annual rate of 4.32 million in November from 4.49 million in October, and are 0.9 percent below the 4.36 million-unit level in November 2012. The median existing single-family home price was $196,200 in November, which is 9.4 percent above a year ago.
Existing condominium and co-op sales dropped 7.9 percent to an annual rate of 580,000 units in November from 630,000 units in October, and are 3.3 percent lower than the 600,000-unit pace a year ago. The median existing condo price was $197,400 in November, up 10.0 percent from November 2012.
Regionally, existing-home sales in the Northeast declined 3.0 percent to an annual rate of 650,000 in November, but are 6.6 percent above November 2012. The median price in the Northeast was $242,900, up 5.7 percent from a year ago.
Existing-home sales in the Midwest fell 4.1 percent in November to a pace of 1.17 million, but are unchanged from a year ago. The median price in the Midwest was $151,100, which is 6.7 percent higher than November 2012.
In the South, existing-home sales declined 2.4 percent to an annual level of 2.01 million in November, but are 1.0 percent above November 2012. The median price in the South was $168,700, up 7.7 percent from a year ago.
Existing-home sales in the West dropped 8.5 percent to a pace of 1.07 million in November, and are 10.1 percent below a year ago, in part from constrained inventory conditions. The median price in the West was $284,400, up 16.5 percent from November 2012.
Here are our overviews of existing home sales not revised.
Recent comments