According to the Mortgage Monitor for September (pdf) from Black Knight Financial Services (BKFS, formerly the LPS Data & Analytics division), there were 892,796 home mortgages, or 1.76% of all mortgages outstanding, remaining in the foreclosure process at the end of September, which was down from 935,460, or 1.80% of all active loans that were in foreclosure at the end of August, and down from 2.63% of all mortgages that were in foreclosure in September of last year. These are homeowners who had a foreclosure notice served but whose homes had not yet been seized, and September's so-called "foreclosure inventory" was the lowest percentage of homes in foreclosure since early 2008.. New foreclosure starts, however, rose in to 91,038 in September from 81,612 in August and have now risen four out of the last five months, while they still remain well below the 108,953 foreclosures started in September of last year...
In addition to homes in foreclosure, September data showed that 2,877,977 mortgage loans, or 5.67% of all mortgages, were at least one mortgage payment overdue but not in foreclosure, down from 5.90% of homeowners with a mortgage who were more than 30 days behind in August, and down from the delinquency rate of 6.46% a year earlier. Of those who were delinquent in August, 1,117,525 home owners were considered seriously delinquent, which means they were more than 90 days behind on mortgage payments, but still not in foreclosure at the end of the month. Thus, a total of 7.43% of homeowners with a mortgage were either late in paying or in foreclosure at the end of September, and 3.97% of the total were in serious trouble, ie, either "seriously delinquent" or already in foreclosure at month end...
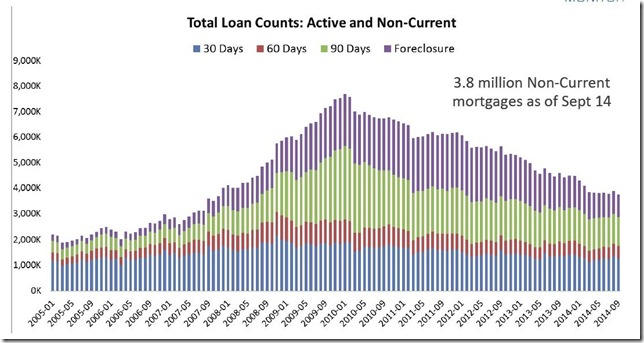
The graph below, from page 6 of the Mortgage Monitor pdf, is a graphic representation of the number of mortgages that were in trouble in each month since the beginning of 2005. The height of each bar corresponds with the total delinquent and in foreclosure mortgage loans for that given month, and within each of those bars the purple color indicates the number of homes in foreclosure, the green indicates the number of mortgages that were more than 90 days delinquent but not yet in foreclosure, the red indicates the number of mortgages that were between 60 and 90 days past due, and the blue indicates the number of mortgages that had just missed one monthly payment...
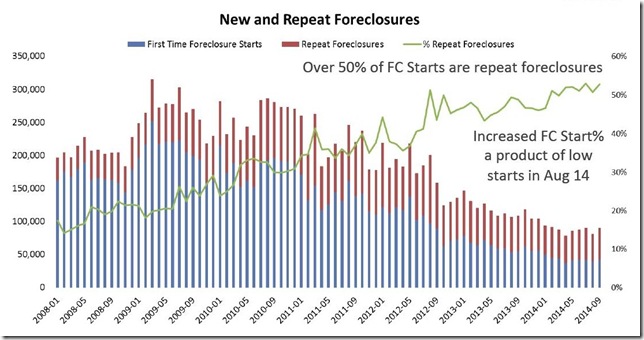
The next graph below, taken from page 5 of the Mortgage Monitor, is a graphic representation of the prior status of the new foreclosure starts as they occurred in each month since the beginning of 2008. Each bar represents a month and within each bar we have foreclosure starts on mortgages that have never been in trouble previously in blue, and foreclosure starts on mortgages that had been in foreclosure at least once before, presumably cured their previous foreclosure by either catching up on payments or through a modification of their loan, only to fall behind on payments again and end up in foreclosure another time. The green line then shows these repeat foreclosures as a percentage of total foreclosure starts for the month, and as they note, for the past 6 months more than half of new foreclosures are such repeaters...(they also try to suggest that the 11.55% increase in September foreclosure starts was a result of an abnormally low number of foreclosure starts in August, but since April foreclosures were almost 5% lower than August, that seems like a spin on the normal range to us)
A major focus of this month's report was to spotlight the large percentage of outstanding second lien home equity lines of credit (HELOCs) that originated between originated between 2005 and 2007, most of which have draw periods of ten years, and hence will either owe a balloon payment or begin amortizing over the next three years. The bar graph below, from page 19 of the pdf, shows in each bar the percentage of such HELOCs that end their draw period in each of the years from 2005 to 2024, with the percentage of them that have negative equity in green, barely positive (0-10%) equity in red, and more than 10% equity in blue shown within each bar. As the callouts within the graphic note, less than 8% of HELOCs have reached the end of their draw to date, and it's clear the majority of them will be coming due over the next three years, incurring an average $262 per month increase in monthly payments each. BKFS also notes that of those that end their draw over the next five years, 17% have negative equity, and 12% have less than 10% equity. This is a concern because previous studies have indicated that those with little or negative equity are more likely to default on their mortgages and hence end up in foreclosure than those with a large equity stake...
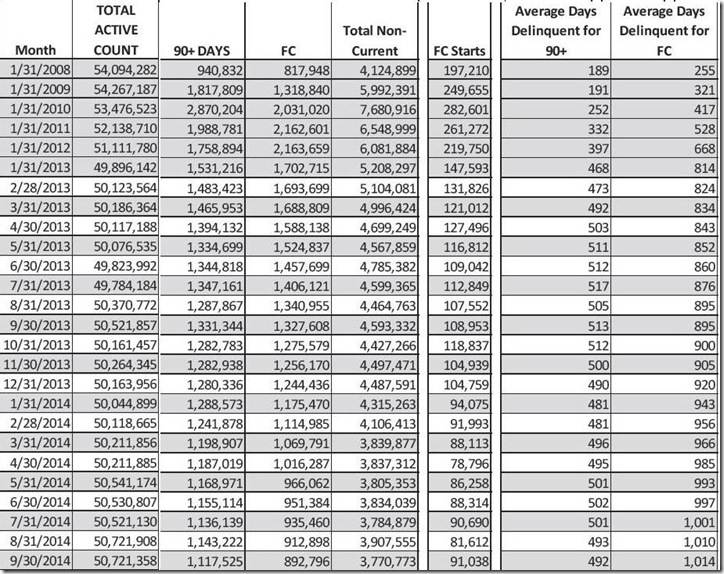
Once again, we'll include the Mortgage Monitor table showing the monthly count of active home mortgage loans and their delinquency status, which comes from page 28 of the pdf. The columns here show the total active mortgage loan count nationally for each month given, number of mortgages that were delinquent by more than 90 days but not yet in foreclosure, the monthly count of those mortgages that are in the foreclosure process (FC), the total non-current mortgages, including those that just missed one or two payments, and then the number of foreclosure starts for each month shown going back to January 2008. In the last two columns, we see the average length of time that those who have been more than 90 days delinquent have remained in their homes without foreclosure, and then the average number of days those in foreclosure have been stuck in that process because of the lengthening foreclosure process. Notice that although the average length of delinquency for those who have been more than 90 days delinquent without foreclosure has remained nearly steady over the past year and is now at 492 days, the average time for those who’ve been in foreclosure without a resolution has lengthened to a record average 1014 days…
(the above was excerpted from my weekly summary at MarketWatch 666)


Comments
Over three years average to foreclose
Wow, and the press, politicians "act like" the housing crisis is all better, no more problems, it's all good.
long foreclosure pipelines
simply put, 1.76% of mortgages are still in foreclosure, and a lot of them have been that way for a long time...we really dont have information as to why; the servicers blame court delays, but the pipelines in non-judicial states are almost as long as in judicial states; could be some combination of chain of title and hence right to foreclose being lost in the poorly upkept automated systems, & banks feeling that homes are better cared for with someone living in them than being empty and prey for vandals...
rjs
MBA report on the same...
just a footnote to this; on friday, the MBA (mortgage bankers association) released their 3rd quarter mortgage delinquency survey, which unlike the Mortgage Monitor, is seasonally adjusted; they found that 2.39% of all mortgages were in the foreclosure process at the end of the quarter, down from 2.49% at the end of the 2nd quarter, while an additional 5.85% of home owners with a mortgage were at least one month overdue on their payments but not in foreclosure at the end of the quarter, down from a delinquency rate of 6.04% at the end of the 2nd quarter...so their numbers are a bit higher than BKFS, who are a mortgage servicing & analytics agency...
rjs