
Q2 2012 real GDP shows 1.7% annualized growth in the 2nd estimate release. The advance GDP estimate was 1.5%.
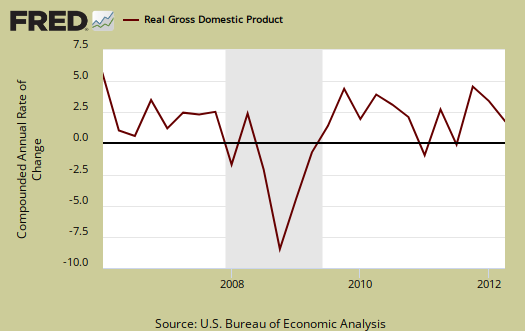
The revisions are a result of slightly better consumer spending, a dramatic drop in investment, and less of an increase in real imports than originally estimated. What the GDP second estimate shows is a sluggish, barely breathing economy. Businesses shed inventories instead of increased them, a dramatic swing from the Q2 GDP advance report. Shedding inventories can be a recession indicator.
As a reminder, GDP is made up of: where Y=GDP, C=Consumption, I=Investment, G=Government Spending, (X-M)=Net Exports, X=Exports, M=Imports*.
The below table shows the percentage point breakdown of the individual components contribution to overall GDP from the Q2 advance to second revision release. The difference, or spread, between GDP revision components is by percentage point contributions to Q2 GDP.
| Comparison of Q2 2012 GDP Component Revisions | |||
|---|---|---|---|
|
Component |
2nd Estimate |
Advance |
Spread |
| GDP | +1.73 | +1.54 | +0.19 |
| C | +1.20 | +1.05 | +0.15 |
| I | +0.40 | +1.08 | -0.68 |
| G | –0.18 | –0.28 | +0.10 |
| X | +0.82 | +0.73 | +0.09 |
| M | –0.51 | –1.04 | +0.53 |
The below table shows the percentage point spread breakdown from Q1 to Q2 GDP major components.
| Comparison of Q1 2012 and Q2 2012 GDP Components | |||
|---|---|---|---|
|
Component |
Q1 2012 |
Q2 2012, 2nd |
Spread |
| GDP | +1.96 | +1.73 | -0.23 |
| C | +1.72 | +1.20 | -0.52 |
| I | +0.78 | +0.40 | -0.38 |
| G | –0.60 | –0.18 | +0.42 |
| X | +0.60 | +0.82 | +0.22 |
| M | –0.54 | –0.51 | +0.03 |
As we can see in the first table, gross domestic private investment imploded in comparison to the advance GDP estimate for Q2. The reason is the change in private inventories. The advance GDP estimate showed a +0.32 percentage point contribution by the changes in private inventories. The 2nd estimate shows a -0.23 percentage point contribution. This is a -0.55 percentage point spread from the advance to the second estimate GDP release. Below are the change in real private inventories.

Fixed investment also was revised down, from +0.76 to +0.63 and not a good sign. Fixed investment can show businesses are planning for increased activity and production down the road.
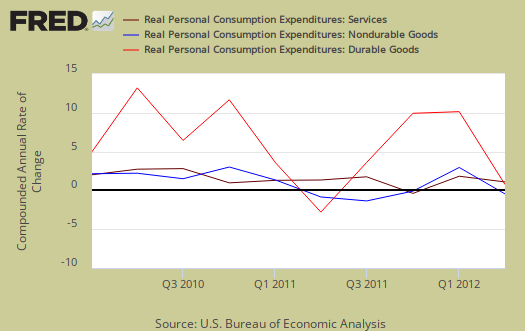
The bump up in consumer spending isn't all that it's cracked up to be either. Durable goods actually decreased from the advance estimate, from a +0.18 percentage point contribution to +0.09. Motor vehicles and parts durable goods shows a –0.25 percentage point contribution to Q2 GDP. The increase in consumer spending was all household utilities. In the advance GDP report household utility spending was a +0.40 percentage point contribution. In the 2nd estimate, household utilities contributed +0.67 percentage points to GDP. Below is PCE with the quarterly annualized percentage change breakdown of durable goods (red), nondurable goods (blue) versus services (maroon).
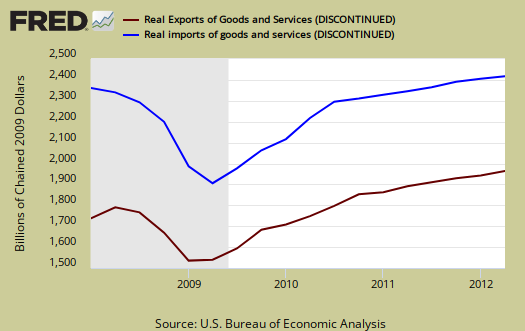
Imports were dramatically overestimated it appears in the Q2 advance report, a -1.04 percentage point contribution instead of the revised –0.51. The below graph shows real imports vs. exports in billions. The break down of the GDP percentage change to point contributions gives a clear picture on how much the trade deficit stunts U.S. economic growth.
This is an abbreviated overview of Q2 GDP revisions. The advance report overview goes into much more depth and the graphs are revised. There will be a 3rd revision of Q2 GDP and we will overview those results in depth. Suffice it to say, in spite of the GDP bump up this revision gives, it's really not great news.
Recent comments