
The recession is here (and has been since last December). It's going to hang around for a while longer at least. And layoffs and unemployment are almost certainly going to continue to increase right through election day, which is bad news for the people who will lose their jobs, but at least has the silver lining that it will increase the chances of Democrats doing very well indeed this November.
That being said, like seeing the green shoot of a crocus popping up above the ground at the end of January, I am seeing the first nascent signs that the economy may enter a period of respite by the end of this year, either growing very slowly or at least the pace of contraction slowing down to a crawl.
(For the record, I've suggested there might be a 2008 year-end "respite" in our economic crisis, since late last year, in this comment and this diary and this one as well).
Here's my evidence:
The most infallible combination of recession indicators includes the yield curve, already discussed, and the "real money supply", which is the whether or not more money is entering the economy than the rate of inflation. This is a variation of the proprietary "foolproof recession indicator" of Paul Kasriel, as modified by Mike Shedlock a/k/a Mish. I won't lay out any highfalutin explanation of it, but you can click on the link and read how it works. We can put together this indicator from pubic data very easily. It consists of two items: (1) an inverted yield curve (does the short-term 3 month treasury note pay higher interest than a 10 year treasury bond? and (2) negative "real" money supply (is the growth in M1 less than the inflation rate?). If both of those questions are answered "yes", a recession is very likely. If both are answered "no", it is very likely you are in economic expansion. Again, don't worry about understanding it. We just look at the graphs and see which line is higher than the other.
1. The yield curve predicts a recovery:
Those of you who follow my diaries and comments know that I place a lot of reliability on what the price of bonds tells us about what is happening with money. In late 2006 and throughout the first half of 2007, short term money demanded as much interest as long term money. This forecast a slowdown and ultimately a recession, and in the end of 2006 I predicted a recession by year end 2007 as a result (despite lots of intelligent people saying "it's different this time"). That prediction has finally been validated by the negative GDP reading of the end of 2007.
But at the same time, by the end of 2007, the yield curve was returning to a normal, positive slope, meaning short term money paid less than long term money. During the last 50+ years, that has always meant an improving economy. And so I have been calling for a "respite" or breathing room by the end of this year. This is shown on two graphs: the first is Prof. James Hamilton's "odds of recession" calculator, that makes use of interest rates, showing that the maximum odds of recession were in spring of this year and have been declining ever since:

And here are two snapshots of the yield curve. The snapshot on the left shows that it was most "inverted" in March 2007, and that by the end of October 2007 it was resuming its normal, positive slope. The black line on the snapshot on the right is from January 4 of this year, showing an even stronger positive slope.
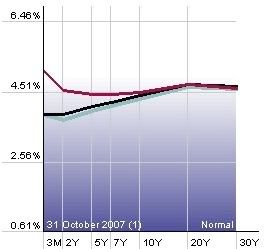
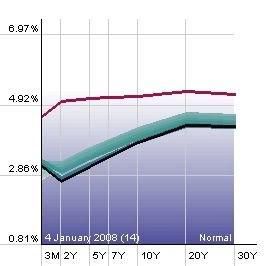
Since the yield curve tends to predict the economy a year out, we can surmise that the economy might be imroving by election day. (But because layoffs and unemployment tend to LAG the overall economy, we can expect for the worst of those to be hitting just at about election day).
So, the answer to the first question in the "foolproof recession indicator" is "no."
2. Money supply has begun to increase
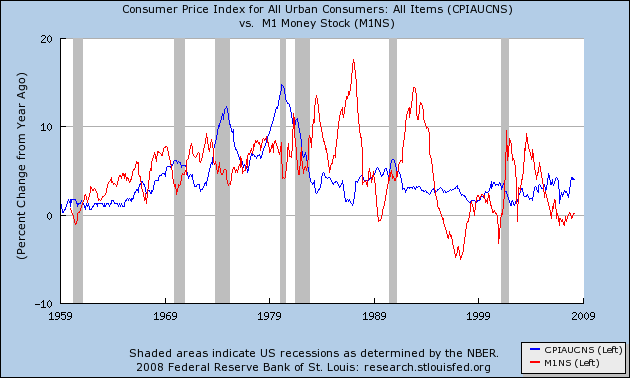
Here is a graph of money supply (M1) and the inflation rate (from a few months ago). Note that in all recessions, the money supply (red) is less than the inflation rate (blue):
Now, here is a close up of the same chart, but more recently, including July 2008:
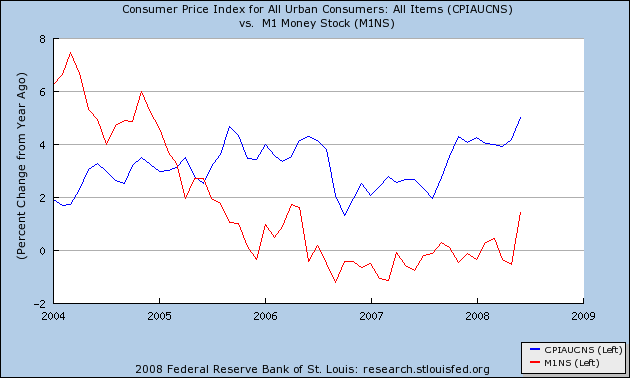
Note that the money supply, for the first time in several years, is starting to increase. IF that trend continues (and there is no way to know if it will or not), and IF the decrease in the price of Oil means that the inflation rate decreases, then perhaps as early as election day, the "real money supply" will have turned positive again.
As you can see from the first graph in this section, decreasing inflation, with positive and increasing money supply, has always been a signal that recession is near an end. So our answer to the second question in the "foolproof recession indicator" is "yes" for now, but maybe "no" soon.
3. A 25% decline in the price of Oil, IF it is sustained, will lubricate the economy
Here's the chart of the price of Oil per barrel for the last 4 months. Oil has fallen almost 25% in a little over a month.

There is no guarantee that price decline will persist (although I think it likely that it will, with ups and downs of course, through the end of this year). If it does, that is more money in consumers pockets to save or spend. That helps the economy. It also does something else: it strongly suggests that the inflation rate may decline dramatically in the next few months (as it typically does late in recessions). I've done a "back of the envelope guesstimate that I won't go into further here except to say that if the price of Oil were to remain in the $133-$120 range it is in now, I would expect the year end inflation rate to be something like 3.8%. For more on the likelihood of the inflation rate decreasing over the next few months, read my note from yesterday.
4. We are approaching the eye of the hurricane in mortgage resets
Most of you probably remember this, frequently-published graph of mortgage resets, showing as it were two humps in the back of the camel: the first is "subprime" mortgage resets, the second is "Alt-A" or higher end alternate documentation resets. Notice there is a break in between the two:
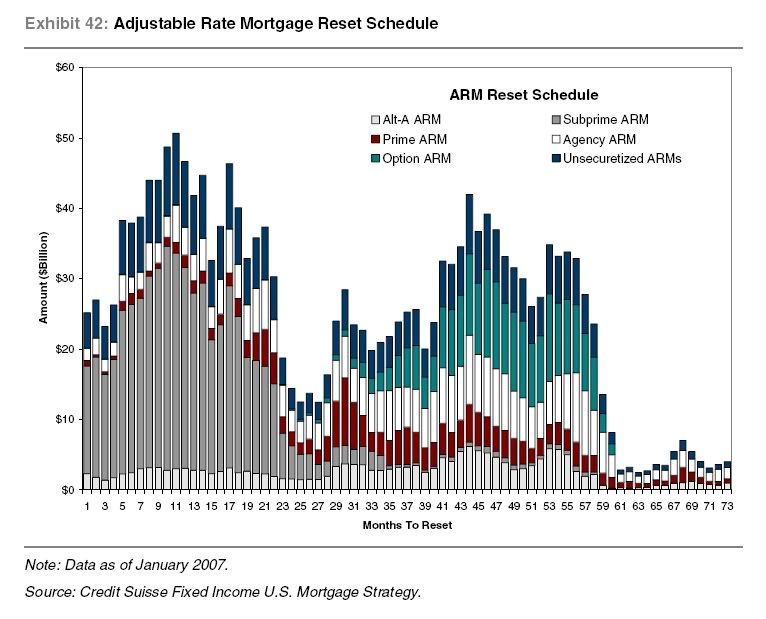
That graph is monthly and begins in January 2007. The break, or the eye of the mortgage reset hurricane, begins in month 23. We are currently in month 20. As subprime mortgage resets end, the housing/finance industry will have a 6 month pause before the second half of the financial hurricane hits.
Conclusion
Let me be clear: I am not saying that the recession is ending now, only that we are seeing the first signals that it may end within the next 6 months. And that won't end our financial crisis or the "slow motion bust". The second part of the housing reset hurricane will begin to hit next year. And there is no way to know right now what will happen with money supply or inflation. So there could very well be a renewed recession next year. But that is the subject of some other diary!
Comments
Mortgage resets
The CBO says The Housing Bill will help about ~400k of homeowners out of the expected 2.2M foreclosures.
Looking at that tsunami fast approaching, is it a drop in the bucket for people who actually own homes?
And is 2.2M further foreclosures low?
Just this month we had 272.171k homes foreclosed on, a 55% increase from 1 year ago and looking at this graph it looks like the hurricane is moving right into regular mortgages.
Would they even qualify under the Housing bill and what is the critera?