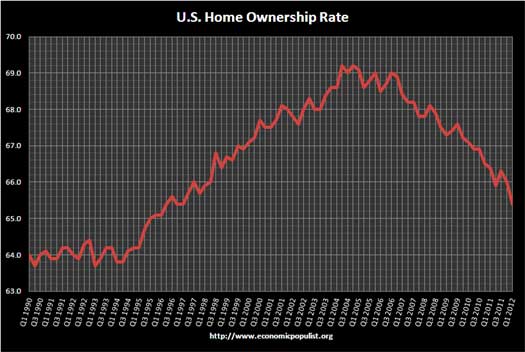
The Census Bureau released the Q4 home ownership, rental and vacancy rates for Q1 2012. Home ownership dropped 1.0% from Q1 2011 to 65.4%, a 0.6% drop from last quarter. This is the lowest home ownership rate since the end of 1996 and the first quarter of 1997.

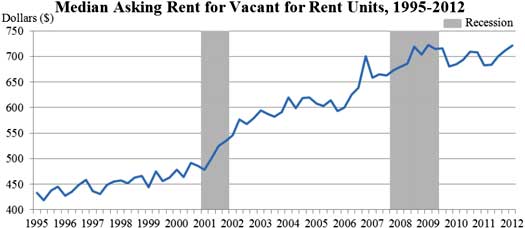
The vacancy rate for rentals is 8.8%, which is also 0.6% lower than Q4 2011 and 0.9% lower from a year ago. Rents are going up with the median rent for empty units being $721/month.

The vacancy rate for home ownership is 2.2% which is 0.4 percentage points lower than Q1 2011. Q4 2011's home ownership vacancy rate was 2.3%.
Approximately 86.1 percent of the housing units in the United States in the first quarter 2012 were occupied and 13.9 percent were vacant. Owner-occupied housing units made up 56.3 percent of total housing units, while renter-occupied units made up 29.8 percent of the inventory in the first quarter 2012. Vacant year-round units comprised 10.6 percent of total housing units, while 3.4 percent were for seasonal use.
Below is the percentage of housing held off the market, which implies shadow inventory. There are currently 132,596,000 housing units in the U.S. In Q1 2012, 18,474,000 were vacant and of those, 7,633,000 were held off the market with that other reason as to why they were off the market being 4,053,000 housing units.
Approximately 2.9 percent of the total units were for rent, 1.2 percent were for sale only, and 0.6 percent were rented or sold but not yet occupied. Vacant units that were held off market comprised 5.8 percent of the total housing stock. Of these units, 1.7 percent were for occasional use, 1.0 percent were temporarily occupied by persons with usual residence elsewhere (URE), and 3.1 percent were vacant for a variety of other reasons.
There is much more data and statistics, including graphs on the Census website, although the presentation is a real dig. That said, regional statistics on home ownership and vacancy rates are available.

Recent comments