
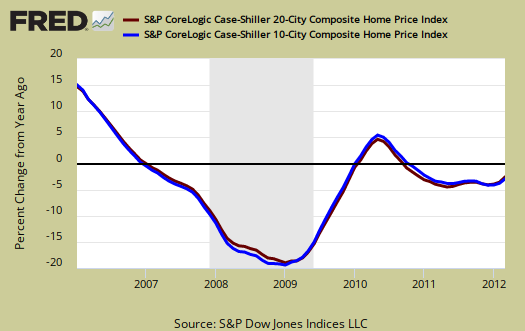
The March 2012 S&P Case Shiller home price index shows a -2.6% decline from a year ago for over 20 metropolitan housing markets and a -2.8% decline for the top 10 housing markets from March 2011. Home prices are back to October 2002 levels for the composite-20 and April 2003 for the composite-10 and are at new lows. Both composites are now down -35% from their 2006 home price bubble peaks. Below is the yearly percent change in the composite-10 and composite-20 Case-Shiller Indices. These are not seasonally adjusted, but comparing from March 2011.
The bottom line from S&P is home prices have not turned the corner. This month saw five cities, Atlanta, Chicago, Las Vegas, New York and Portland, hit new index lows. That said, we have the obligatory sun will come out tomorrow song from S&P.
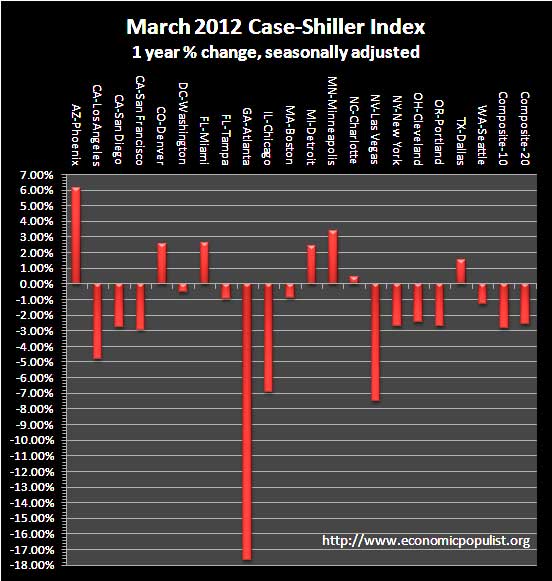
There are some better numbers: Only three cities – Atlanta, Chicago and Detroit – saw annual rates of change worsen in March. The other 17 cities and both composites saw improvement in this statistic, even though most are s till showing a negative trend. Moreover , there are now seven ci ties – Charlotte, Dallas,
Denver, Detroit, Miami, Minneapolis and Phoenix – where the annual rates of change are positive. This is what we need for a sustained recovery; monthly increases coupled with improving annual rates of change. Once we see this on a broader level we will be able to say the market has turned around.
We cannot tell you how many analysts and reports have claimed housing prices have bottomed. We don't buy in, not with high unemployment rates and jobs with repressed wages.
Below are all of the composite-20 index cities yearly price percentage change, using the seasonally adjusted data. We can see Atlanta imploding this year. While Phoenix looks good, bear in mind not seasonally adjusted Phoenix is down 53% from its peak.
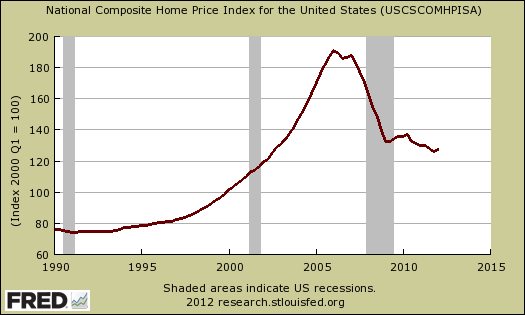
Case-Shiller quarterly home price data is reported as a national index and is also at a new record low. S&P reports the national index declined -2.0% from Q1 2012, but this is using the not seasonally adjusted data. Seasonally adjusted the national index actually increased 1.1% from Q4 2011. Comparing the same quarter from a year ago, Q1 decreased -1.9%. The year ago quarterly decline is for both the seasonally adjusted and not seasonally adjusted data. The not seasonally adjusted national index is down -35.1% from it's Q2 2006 bubble peak. Below is the seasonally adjusted Case-Shiller home price quarterly national index. If you want to see the housing bubble, just look below.
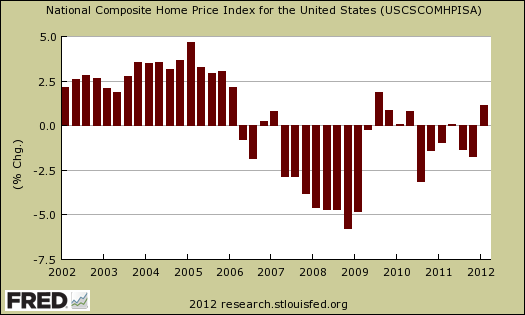
Below is the quarterly national index percent change from a year ago, using the seasonally adjusted data.
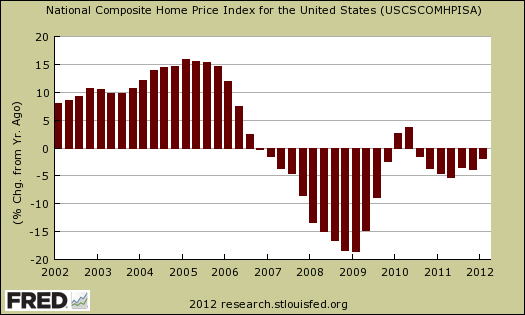
Finally, the national index using the seasonally adjusted data, quarterly percentage change is graphed below.
News headlines on the S&P Case-Shiller Housing Index often differ. Some in the press use the seasonally adjusted data, and others do not. S&P themselves use the not seasonally adjusted housing price data. To make matters worse, some in the press compare just the monthly not seasonally adjusted data and others compare the housing price index to one year ago, without telling you what number they are quoting from S&P. That's why on this site we make sure you know which apple you're looking at, all data is identified. For more details on seasonal adjustments, see the bottom paragraphs of this overview.
This month the not seasonally adjusted February to March change for the composite-20 was 0.0%. The seasonally adjusted composite-20 monthly change was +0.1% (maroon). The composite-10 not seasonally adjusted monthly change was -0.1% and the seasonally adjusted composite-10 monthly change was +0.1% (blue). The below graph shows both composites, using the seasonally adjusted series.
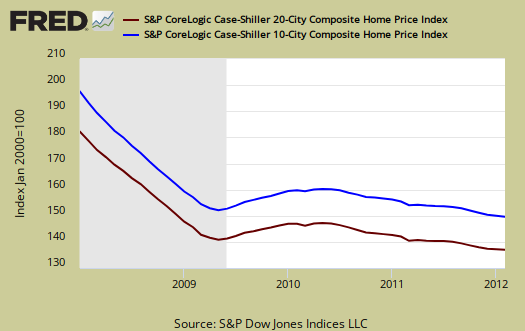
The above graph shows the composite-10 and composite-20 city home prices indexes, seasonally adjusted. Prices are normalized to the year 2000. The index value of 150 means single family housing prices have appreciated, or increased 50% since 2000 in that particular region. These indices are not adjusted for inflation. The composite-20 index, seasonally adjusted is 136.9 and comparable to January 2003 levels (ignoring 2009). Not seasonally adjusted the composite-20 index is 134.1, between October 2002 and November 2002 levels. Clearly the bottom in home prices cannot be called.
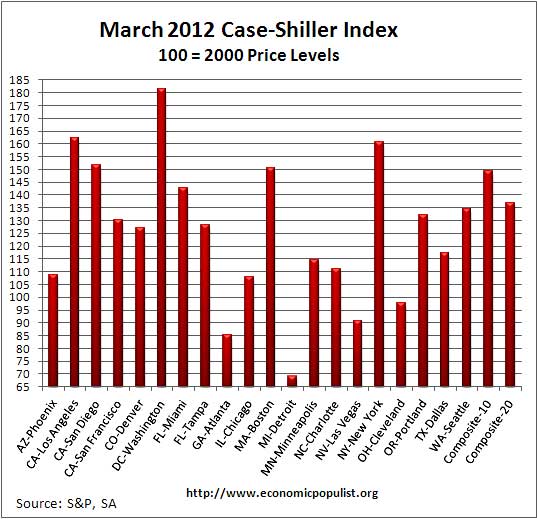
Below are the seasonally adjusted indices for this month. Folks spin these indexes with percentages while the index itself tells you what has happened to home prices, per city, from the year 2000. Remember the below is seasonally adjusted.
To Season or Not to Season, That is the Question:
The S&P/Case-Shiller Home Price Indices are calculated monthly using a three-month moving average and published with a two month lag. Their seasonal adjustment calculation is the standard used for all seasonal adjustments, the X-12 ARIMA, maintained by the Census.
So, why would S&P report the not seasonally adjusted data? According to their paper on seasonal adjustments, they claim the not seasonally adjusted indices are more accurate. It appears the housing bubble burst screwed up the cyclical seasonal pattern. What a surprise, although those steep cliff dives are now going back to 2009, one would think the seasonally adjusted data would now start to converge back to it's cyclical, seasonal pattern.
The turmoil in the housing market in the last few years has generated unusual movements that are easily mistaken for shifts in the normal seasonal patterns, resulting in larger seasonal adjustments and misleading results.
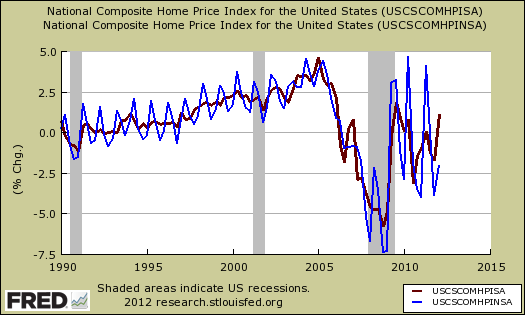
To see S&P's argument in action, look at the below graph. The maroon line is the seasonally adjusted national index, reported quarterly. The blue line is the not seasonally adjusted national index. As we can see before the housing bubble burst, we see a typical cyclical pattern difference between the seasonally adjusted and not seasonally adjusted data points. Yet after the bubble burst we see large swings, which would throw off a seasonal adjustment adaptive algorithm. This is going to become a major question among statisticians, how does one adjust for seasonality in the face of tsunami like economic events?
Not seasonally adjusted data can create more headline buzz on a month by month basis due to the seasonality of the housing market. S&P does make it clear that data should be compared to a year ago, to remove seasonal patterns, yet claims monthly percentage changes should use not seasonally adjusted indices and data. This seems more invalid than dealing with the statistical anomalies the massive housing bubble burst caused.
For more Information:
S&P does a great job of making the Case-Shiller data and details available for further information and analysis on their website.
Here is our overview from last month.
Recent comments