
The Federal Reserve is publishing a 1.0% increase from last month in industrial production Here is a detailed report.
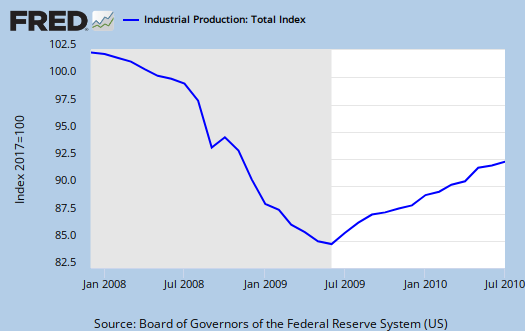
The good showing was due to automotive 9.9% increase in cars, trucks & parts industrial group, yes 9.9% change, in a month. Even without motor vehicles, industrial production increased 0.6% for July. Mines output increased 0.9%, utilities increased 0.1%. For the year, industrial production is up 7.7%, but still 6.6% below 2007 levels.
- manufacturing: +1.1%
- mining: +0.9%
- utilities: +0.1%
Total capacity for the month was unchanged. Advanced technologies manufacturing raw capacity was up 0.8% for the month and utilities increased 0.1% in raw capacity for the month.
For industrial production the marketing group major changes are (monthly rate):
- Final Products: +1.0%
- Consumer goods: +1.1%
- Business equipment: +1.8%
- Nonindustrial supplies: +0.4%
- Construction: +0.5%
- Materials: +0.9%
Of all the economic reports, this is one I trust least. Take a revision statement from this report for example:
For this release, monthly indicators (either product data or input data) were revised, and the estimation methods for some series were changed. The new monthly production estimates reflect the incorporation of updated seasonal factors and monthly and quarterly source data that became available (or were revised) after the closing of the reporting window.
The main Federal Reserve releases this report. The PDF text is impossible to copy, the graphs are not clear, the data hard to obtain and last month the revisions were not comprehensible to the public reader. For example, the summary on major market groups percent industrial production change, does not match table 1, seemingly the same metric. It's not clear if the summary is annualized, yet this would imply other data points would not match table 1, yet the values do. Data discrepancies are usually the misunderstanding of the reader, and this reader, tries to chase down the confusion, but when it comes to this particular economic report, I often cannot resolve discrepancies.
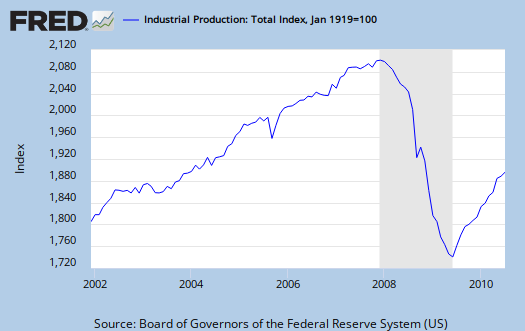
Below is industrial production since December, 2001. As one can see we have not recovered to even pre-recession levels.
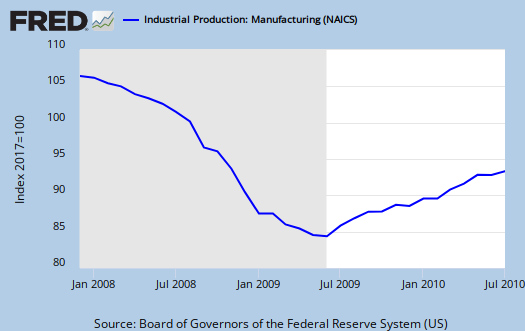
Below is manufacturing industrial production, also not at pre-recession levels.
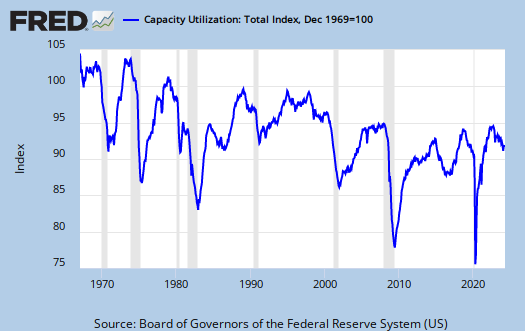
Capacity utilization, or of raw capacity, how much is being used, increased to 74.8%, from last month's 74.1%. Below are capacity utilization's monthly percent change breakdown. It is unclear if these values are annualized, so consider them raw monthly percentage changes.
- manufacturing: +0.8%
- mining: +0.9%
- utilities: -0.1%
- crude: +0.7%
- primary: +0.6%
- finished: +0.9%
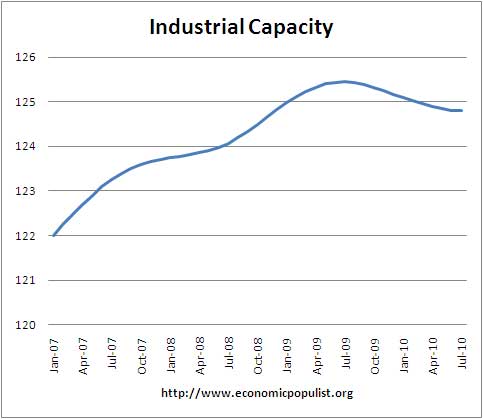
The below graphs show the overall decline of U.S. capacity utilization. Capacity utilization is how much can we make vs. how much are we using. These graphs show the U.S. is simply not producing what it is capable of, a reflection of the output gap. Note, this index is normalized to a specific year, currently from most reports, the 2007 yearly average (see year in the graph). Therefore, one cannot take absolute values of capacity utilization, i.e. 80%, and claim this is an indicator of a healthy economy, for it all depends on what year capacity utilization is normalized to. One can take the slope, or change from the peak of a recession and determine recovery, but again, these percentages are relative, they are not absolute ratios to a static point in time. Also recall utilization is a percentage of real total capacity. Notice that total capacity in the United States has declined.
Below is the Manufacturing capacity utilization graph. Too often the focus is on the monthly percent change, so it's important to compare capacity utilization to pre-recession levels.

Last month's overview of the Industrial Production economic report is here.
Recent comments